Trading View Tickers

Friday 19 January 2024

GBP/USD Plummets Following UK Retail Sales Data, Bitcoin Price Hovers Below $42K

The GBP/USD pair is experiencing a significant drop, heading towards 1.2650. 


This comes in the wake of an unexpectedly sharp decline in UK Retail Sales data for December. The pair is also being impacted by a halt in the decline of the US Dollar, as overall market sentiment remains subdued ahead of key US data and Federal Reserve commentary.

GBP/USD Chart

GBP/USD Chart

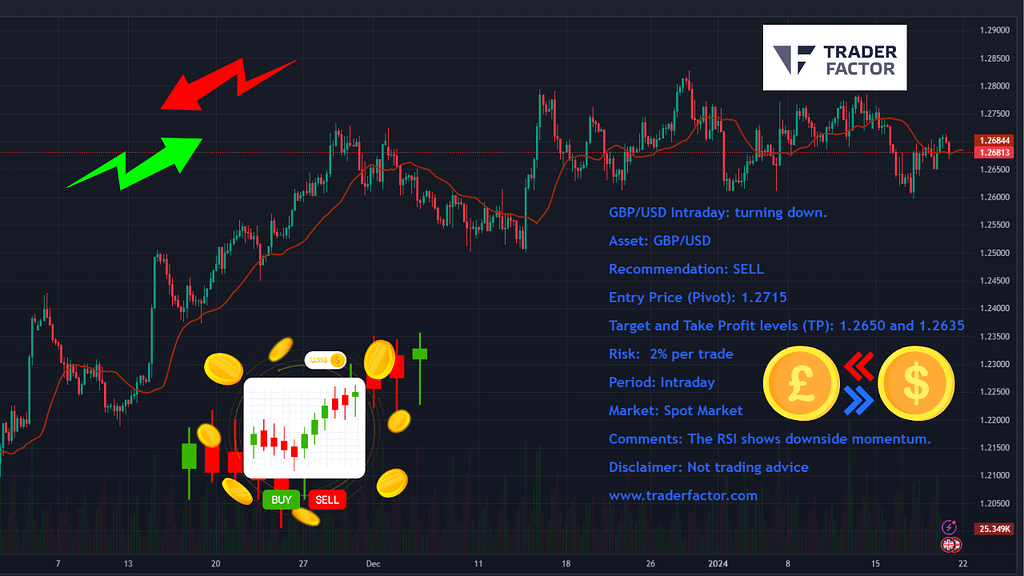
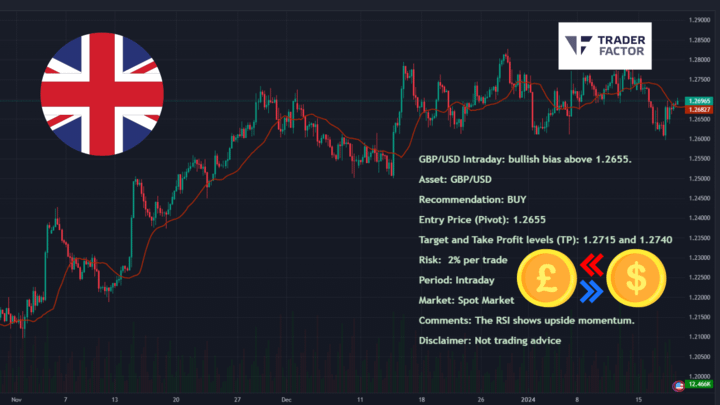
The British Pound to US Dollar (GBP/USD) exchange rate is predicted to face a downturn in the intraday market, according to recent analyses and forecasts. The current recommendation for the asset stands at “SELL”, with an entry price (pivot) set at 1.2715.

Analysts forecast a bearish trend for the currency pair, with target and take profit levels identified at 1.2650 and 1.2635 respectively. As per these predictions, traders should be prepared to risk no more than 2% per trade.

The RSI for the GBP/USD pair indicates a downward momentum, providing further impetus for the “SELL” recommendation.

December 2023 UK Retail Sales Take a Dive

The retail sector experienced a significant downturn in December 2023, with sales volumes plunging by 3.2%, a stark contrast to the 1.4% rise witnessed in November 2023 (revised up from an initial 1.3% increase). This fall, the most substantial since January 2021, was primarily due to the impact of COVID-19 restrictions on the retail landscape.

Examining the quarterly performance, sales volumes recorded a 0.9% drop in the last three months of 2023, as compared to the preceding three-month period.

In terms of specific categories, non-food store sales volumes decreased by 3.9% in December 2023, following a 2.7% rise in November 2023, which was spurred by Black Friday sales and extensive discounting.

Food store sales volumes also dipped by 3.1% in December 2023, down from a 1.1% increase seen in November 2023.

Non-store retailing, which primarily includes online retailers, saw sales volumes decline by 2.1% in December 2023, succeeding a 1.1% drop in November 2023.

Automotive fuel sales volumes also registered a dip, falling by 1.9% in December 2023 after a 0.8% increase in November 2023.

On a year-on-year basis, sales volumes dropped by 2.8% in 2023, marking the lowest level since 2018.

Retail CategoryChange in Sales Volumes – December 2023 (%)Change in Sales Volumes – November 2023 (%)
Overall Retail-3.21.4 (Revised up from 1.3)
Non-food Stores-3.92.7
Food Stores-3.11.1
Non-store Retailing-2.1-1.1
Automotive Fuel-1.90.8
Yearly Overall Retail-2.8N/A

EUR/USD Remains Stable Ahead of Lagarde’s Speech

In contrast, the EUR/USD pair is holding steady, lingering just below 1.0900 in European trading sessions on Friday. A slight increase in the US Dollar, coupled with US Treasury bond yields, is exerting pressure on the pair amidst a cautious market atmosphere.

EURUSD Live Chart

European Central Bank (ECB) President Christine Lagarde has refrained from countering predictions of over 150 basis points (bps) rate cuts this year. Despite this, Lagarde warned against premature optimism in the markets due to a rise in Eurozone inflation to a 2.9% YoY rate in December.

Impact of US Economic Factors on EUR/USD

Lackluster US Dollar (USD) price action has not provided any significant momentum to the EUR/USD pair as the week draws to a close. However, positive economic indicators, such as better-than-expected US Retail Sales data and a robust labor-market report, suggest a healthy economy. Hawkish comments from several Fed officials have also reduced expectations of an early interest rate cut.

Additionally, reducing chances of aggressive policy easing by the US central bank have pushed the yield on the benchmark 10-year US government bond to its highest in over five weeks, providing some support to the USD. Nevertheless, the markets are still factoring in a 50% chance of a Fed rate cut in March. This, along with stable performance within equity markets, limits the upside for the safe-haven USD and provides some support to the EUR/USD pair.

Market Participants Await Lagarde’s Commentary

Investors are now looking forward to ECB President Christine Lagarde’s comments at the World Economic Forum for some impetus. During the early North American session, traders will take cues from the US economic docket – featuring the release of the Preliminary Michigan Consumer Sentiment and Inflation Expectations, along with Existing Home Sales data.

Influential FOMC members’ speeches, along with the US bond yields and the broader risk sentiment, could drive the USD demand and produce short-term trading opportunities around the EUR/USD pair. However, spot prices remain on track to register weekly losses due to the underlying bullish tone surrounding the USD.
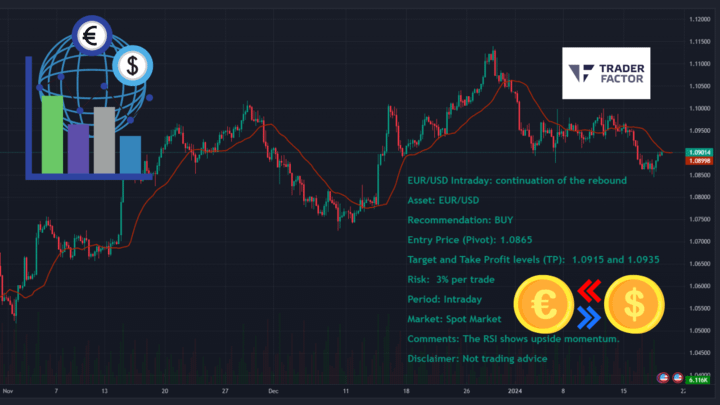
EUR/USD Chart

EUR/USD Chart

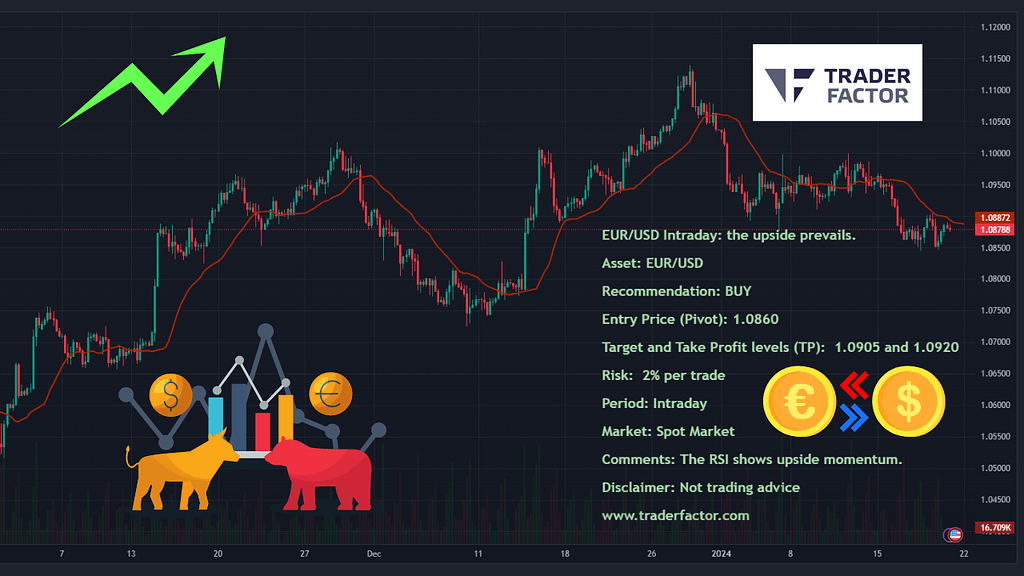
The Euro to US Dollar (EUR/USD) exchange rate is poised for gains in the intraday market, according to recent forecasts and market analyses. The recommendation for the asset currently stands at a “BUY”, with an entry price (pivot) set at 1.0860.

Forecasts suggest a bullish turn for the currency pair, with target and take profit levels identified at 1.0905 and 1.0920, respectively. As per these predictions, traders should be prepared to risk no more than 2% per trade.

The RSI for the EUR/USD pair indicates an upward momentum, providing further impetus for the “BUY” recommendation.

Crude Oil Prediction

West Texas Intermediate (WTI) Crude Oil Chart

West Texas Intermediate (WTI) Crude Oil

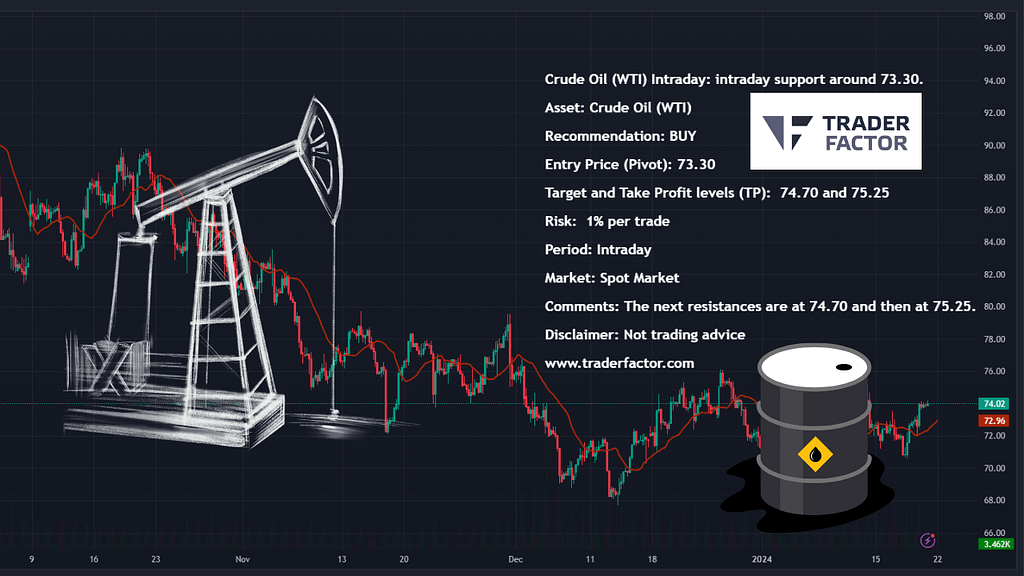
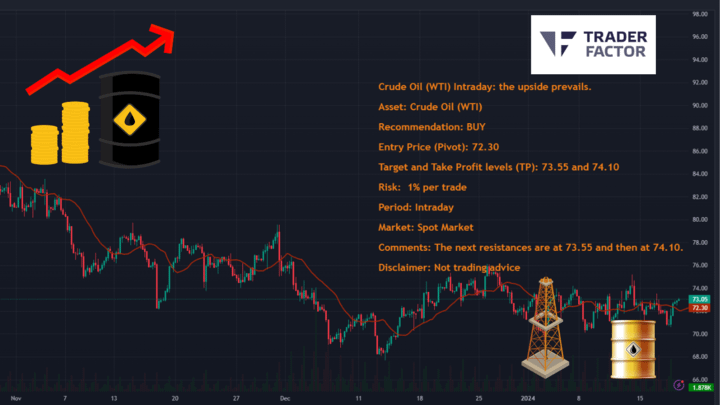
The West Texas Intermediate (WTI) Crude Oil is expected to find intraday support around the $73.30 mark, according to recent market forecasts. The current recommendation for the asset is “BUY”, with an entry price (pivot) set at $73.30.

Analysts predict a bullish trend for WTI Crude Oil, with target and take profit levels identified at $74.70 and $75.25 respectively. As per these predictions, traders should be prepared to risk no more than 1% per trade.

This outlook is further reinforced by the next resistances which are anticipated at $74.70 and then at $75.25.

Gold Price Ascends from $2,000 Low Point: Bullish Trends Predicted Amid Global Uncertainties

The price of gold (XAU/USD) is rebounding, building on its recovery from a low near the psychological $2,000 mark, its lowest since December 13. The precious metal is gaining traction for the second consecutive day, thanks to escalating military activities in the Middle East and concerns over China’s economic stability. These factors are bolstering the appeal of gold as a safe-haven asset.

XAUUSD Chart

XAUUSD Chart

Forecasts suggest an upward trend for Gold in the intraday market, predicting a price of $2037.00. Analysts are recommending a “BUY” for this asset, with a pivot or entry point set at $2013.00.

The bullish trend forecast for gold sets target and take-profit levels at $2030.00 and $2037.00 respectively. Traders, based on these predictions, are advised to risk no more than 1% per trade.

This optimistic projection is driven by current global geopolitical risks prompting investors to seek refuge in gold. Furthermore, the gold price has successfully breached the $2037.50 level and settled back within the intraday bearish channel, reigniting the bearish trend scenario in the short term.

Nonetheless, it’s important to consider that while consolidation may continue, it should be limited. Thus, despite potential short-term price fluctuations, the overall trend suggests a rise in the price of gold.

BTC Price Hovers Below $42,000

Bitcoin’s price is currently lingering below the $42,000 mark. Forecasts suggest a possible rebound for the Bitcoin to US Dollar (BTC/USD) exchange rate towards $42,420 in the intraday market. The prevailing recommendation for this asset is a “BUY”, with a pivot or entry point set at $40,590.

BTCUSD Chart

BTCUSD Chart

Analysts predict a bullish turn for the cryptocurrency pair, with target and take profit levels identified at $42,420. As per these predictions, traders should be prepared to risk no more than 1% per trade.

This outlook is partially supported by the Relative Strength Index (RSI), which is currently below 50, indicating that the market may be oversold and a price increase could be imminent. The Moving Average Convergence Divergence (MACD) is negative but above its signal line, suggesting a mixed configuration.

Moreover, the BTC/USD price stands above its 20-period moving average (at $41,103) but below its 50-period moving average (at $41,865). This indicates a potential turning point or short-term pullback within a bigger trend.

As always, while the intraday bias for Bitcoin / Dollar is currently bullish, it’s crucial for traders to closely monitor market movements and global economic indicators as Bitcoin’s is notoriously volatile.

Disclaimer:

All information has been prepared by TraderFactor or partners. The information does not contain a record of TraderFactor or partner’s prices or an offer of or solicitation for a transaction in any financial instrument. No representation or warranty is given as to the accuracy or completeness of this information. Any material provided does not have regard to the specific investment objective and financial situation of any person who may read it. Past performance is not a reliable indicator of future performance. 

FOLLOW US

Author

  • Zahari Rangelov

    Zahari Rangelov is an experienced professional Forex trader and trading mentor with knowledge in technical and fundamental analysis, medium-term trading strategies, risk management and diversification. He has been involved in the foreign exchange markets since 2005, when he opened his first live account in 2007. Currently, Zahari is the Head of Sales & Business Development at TraderFactor's London branch. He provides lectures during webinars and seminars for traders on topics such as; Psychology of market participants’ moods, Investments & speculation with different financial instruments and Automated Expert Advisors & signal providers. Zahari’s success lies in his application of research-backed techniques and practices that have helped him become a successful forex trader, a mentor to many traders, and a respected authority figure within the trading community.

EUR/USD Nearing 1.0900 as Market Awaits ECB Comments and US Data amidst Dollar Weakness

The EUR/USD pair is hovering near the 1.0900 mark, gaining ground due to renewed weakness in the US Dollar. The European Central Bank (ECB) hawks are pushing back against early rate cut expectations, offering support to the pair. All eyes are now on ECB President Christine Lagarde and upcoming US data.


Asian Market Influence and Eurozone’s Current Account

Continuing its steady trading for a second day, the EUR/USD pair is changing hands at around 1.0880 before the US market opens. The pair’s trading range is limited, with a peak at 1.0906 and a bottom at 1.0876. The soft tone of Asian share markets has capped the Euro’s upside, while stable government bond yields have curtailed the US Dollar’s demand.

EURUSD Daily Chart

EUR/USD Intraday: Continuation of the Rebound

The EUR/USD pair is exhibiting a promising rebound, with an intraday bullish bias. The recommendation for this asset is a BUY at an entry price (pivot) of 1.0865. Traders should aim for target and take profit levels at 1.0915 and 1.0935 respectively. It’s prudent to limit risk to 3% per trade in the spot market. This strategy is driven by the Relative Strength Index (RSI), which currently indicates an upside momentum.

EURUSD Daily Chart

EURUSD Daily Chart

Lagarde’s Panel Discussion and US Data Release Awaited

The Eurozone has released its November Current Account, showing a seasonally adjusted surplus of €24.6 billion. However, Construction Output in the same month dropped by 1%. The American session will bring US Initial Jobless Claims, the Philadelphia Fed Manufacturing Survey, Building Permits, and Housing Starts. Also, ECB President Christine Lagarde will participate in a panel discussion titled “Uniting Europe’s Markets” at the World Economic Forum in Davos.

GBP/USD Rebound Shows Signs of Slowing Down

The GBP’s bullish reaction to Wednesday’s test of the 1.2600 range base seems to be slowing down in the low-1.2700s intraday. The short-term charts indicate increased selling pressure above 1.2700. The current GBP/USD price is 1.2354.

GBP/USD Intraday Prediction

A bullish bias is predicted for GBP/USD above 1.2655 for the intraday period. The recommendation is to buy at an entry price of 1.2655, with target and take-profit levels set at 1.2715 and 1.2740 respectively.

GBPUSD Daily Chart

GBPUSD Daily Chart

Rising Oil Prices on Back of Strong Global Demand

Oil prices climbed on Thursday as the International Energy Agency (IEA) joined OPEC in predicting strong global oil demand growth this year. Brent crude futures increased by 37 cents, or 0.5%, to $78.25 a barrel, while U.S. West Texas Intermediate crude futures rose by 55 cents, or 0.8%, to $73.11.

Crude Oil (WTI) Intraday Forecast

The upside prevails for Crude Oil (WTI) in the intraday period. The recommendation is to buy at an entry price of 72.30, with target and take-profit levels set at 73.55 and 74.10 respectively.

WTI Crude Oil Chart

WTI Crude Oil Chart

Disclaimer:

All information has been prepared by TraderFactor or partners. The information does not contain a record of TraderFactor or partner’s prices or an offer of or solicitation for a transaction in any financial instrument. No representation or warranty is given as to the accuracy or completeness of this information. Any material provided does not have regard to the specific investment objective and financial situation of any person who may read it. Past performance is not a reliable indicator of future performance. 

FOLLOW US

Author

  • Zahari Rangelov

    Zahari Rangelov is an experienced professional Forex trader and trading mentor with knowledge in technical and fundamental analysis, medium-term trading strategies, risk management and diversification. He has been involved in the foreign exchange markets since 2005, when he opened his first live account in 2007. Currently, Zahari is the Head of Sales & Business Development at TraderFactor's London branch. He provides lectures during webinars and seminars for traders on topics such as; Psychology of market participants’ moods, Investments & speculation with different financial instruments and Automated Expert Advisors & signal providers. Zahari’s success lies in his application of research-backed techniques and practices that have helped him become a successful forex trader, a mentor to many traders, and a respected authority figure within the trading community.

Traders Await US Housing and Employment Data as AUD/USD Stays Steady Above 0.6550

The Australian Dollar (AUD) has recovered some of its losses against the US Dollar (USD), largely due to a weaker dollar. However, the overall downtrend is still intact. The mixed data coming out of Australia is now shifting focus to the upcoming US housing and jobless claims figures. It’s predicted that the AUD/USD pair will encounter resistance at 0.6545 and 0.6640.


Earlier Predictions

The Australian Dollar (AUD) is currently trading near 0.6560 against the US Dollar (USD), with an immediate support level at 0.6550. Intraday bias in AUD/USD remains on the upside, as the rise from 0.6269 is in progress towards a resistance of 0.6894. Market analysts are closely observing the AUD/USD pair, predicting that a break below the support level could significantly influence the currency pair’s movement.

However, there is a neutral sentiment regarding the long-term outlook, suggesting the AUD/USD pair has good chances of returning to the 1:1 ratio. Today’s intraday recommendation is to buy at an entry price of 0.6530 with target and take profit levels at 0.6580 and 0.6600 respectively. This intraday prediction is supported by the Relative Strength Index (RSI), which shows an upside momentum.

AUDUSD Daily Chart

Australian Economic Indicators: A Mixed Bag

Australian economic data presents a mixed picture. January saw Consumer Inflation Expectations remain stable at 4.5%, while the number of employed individuals unexpectedly fell, indicating potential weaknesses in the labour market.

Chinese Macroeconomic Data Influence on AUD

China’s GDP Growth Falls Short, Impacting the Aussie

Data released on Wednesday revealed that China’s GDP growth rate for 2023 was 5.2%, falling short of the anticipated 5.3%. In addition, retail sales underperformed, sparking worries about a slow post-pandemic recovery. As China is Australia’s primary trading partner, these factors contribute to the pressure on the Aussie.

Reviewing Australian Economic Data for December 2023

According to the latest reports, the Australian economy experienced mixed outcomes in December 2023. The unemployment rate remained steady, while employment figures saw fluctuations. Here’s a detailed look at the economic indicators for Australia in December 2023.

Employment and Unemployment Rates

In trend terms, the unemployment rate in Australia was stable at 3.8%, while the participation rate remained unchanged at 67.0%. The number of employed individuals increased, reaching 14,246,000. However, the employment to population ratio saw a slight decline, dropping to 64.4%. The underemployment rate held steady at 6.5%, and there was a decrease in monthly hours worked, which fell to 1,928 million.

In seasonally adjusted terms, the unemployment rate held firm at 3.9% in December 2023. The participation rate experienced a slight downturn, decreasing to 66.8%, and employment figures also dropped to 14,201,100. The employment to population ratio declined to 64.2%, and the number of monthly hours worked reduced to 1,926 million.

Full-time and Part-time Employment

In terms of full-time and part-time employment in December 2023, there were notable changes. Full-time employment decreased by 106,600, bringing the total number of full-time employees to 9,791,200 people. In contrast, part-time employment saw an increase, with an additional 41,400 people finding part-time work, bringing the total to 4,409,900 people.

Below is a summary table of the data:

Economic IndicatorTrend TermsSeasonally Adjusted Terms
Unemployment Rate3.8%3.9%
Participation Rate67.0%66.8%
Employment14,246,00014,201,100
Employment to Population Ratio64.4%64.2%
Underemployment Rate6.5%6.5%
Monthly Hours Worked1,928 million1,926 million
Full-Time Employment9,791,200 people
Part-Time Employment4,409,900 people

(Source: RBA)


Disclaimer:

All information has been prepared by TraderFactor or partners. The information does not contain a record of TraderFactor or partner’s prices or an offer of or solicitation for a transaction in any financial instrument. No representation or warranty is given as to the accuracy or completeness of this information. Any material provided does not have regard to the specific investment objective and financial situation of any person who may read it. Past performance is not a reliable indicator of future performance. 

FOLLOW US

Author

  • Zahari Rangelov

    Zahari Rangelov is an experienced professional Forex trader and trading mentor with knowledge in technical and fundamental analysis, medium-term trading strategies, risk management and diversification. He has been involved in the foreign exchange markets since 2005, when he opened his first live account in 2007. Currently, Zahari is the Head of Sales & Business Development at TraderFactor's London branch. He provides lectures during webinars and seminars for traders on topics such as; Psychology of market participants’ moods, Investments & speculation with different financial instruments and Automated Expert Advisors & signal providers. Zahari’s success lies in his application of research-backed techniques and practices that have helped him become a successful forex trader, a mentor to many traders, and a respected authority figure within the trading community.