Download the MetaTrader plugin for Trading Central. This package is easy to install, and gives you access to all TC Alpha Generation indicators, directly on your charts.
Bitcoin / Dollar intraday: our next up target stands at 43970
Our pivot point stands at 42100.
Our preference:
Our next up target stands at 43970.
Alternative scenario:
The downside breakout of 42100 would call for 41370 and 40940.
Comment:
The RSI is above its neutrality area at 50. The MACD is above its signal line and negative. The MACD must break above its zero level to trigger further gains. Moreover, the price is trading above both its 20 and 50 period moving average (respectively at 42367 and 42672).
TraderFactor may publish on its website or send market reports and market news to recipients for informational purposes. The published information is obtained from various publicly available and reliable sources.
TraderFactor shall not assume any liability for the accuracy or completeness of any information in any materials published or displayed on its communication channels (web portals, emails, websites, etc.).
Any Market/financial information (including any opinion), materials, and reports communicated by TraderFactor to recipients by any means on its communication channels (including without limitation the following: web portal, emails, website, etc.) does not take into consideration the recipient’s investment objectives or current financial situation and should not be considered as being investment advice and/or recommendation, and/or an offer to enter into a Contract or an offer to buy or sell or the solicitation of an offer to buy or sell any Instrument.
TraderFactor shall not bear any liability for any loss, including without limitation to, any loss of profit, which may arise directly or indirectly from the use of or reliance on such information; All decisions and actions of any type taken by the Client shall be issued by them and by their absolute free will, and according to their personal conviction, opinion and judgement and under their own and full responsibility.
Before trading with TraderFactor's regulated partnered list of brokers, Clients must know that Trading Foreign Exchange and Contracts for Difference (CFDs) is highly speculative and may not be suitable for all investors.
TRADING CENTRAL Terms and conditions
The information provided does not constitute, in any way, a solicitation or inducement to buy or sell securities and similar products. Comments and analysis reflect the views of TRADING CENTRAL at any given time and are subject to change at any time. Moreover, they can not constitute a commitment or guarantee on the part of TRADING CENTRAL. The recipient acknowledges and agrees that by their very nature any investment in a financial instrument is of a random nature and therefore any such investment constitutes a risky investment for which the recipient is solely responsible. It is specified that the past performance of a financial product does not prejudge in any way their future performance. The foreign exchange market and financial derivatives such as futures, CFDs (Contracts for Difference), warrants, turbos or certificates involve a high degree of risk. They require a good level of financial knowledge and experience. TRADING CENTRAL recommends the consultation of a financial professional who would have a perfect knowledge of the financial and patrimonial situation of the recipient of this message and would be able to verify that the financial products mentioned are adapted to the said situation and the financial objectives pursued. TRADING CENTRAL recommends reading the "risk factors" section of the prospectus for any financial product mentioned.
Head of Research at TRADING CENTRAL: Rémy GAUSSENS
TRADING CENTRAL is governed by the code of conduct of the association ANACOFI-CIF, association approved by the Financial Markets Authority and registered with ORIAS under number 17005458.
U.S.-based Bitcoin Exchange-Traded Funds (ETFs) experienced an impressive trading volume of $4.6 billion on their debut day.
This surge in investor interest followed the approval of these landmark products by the U.S. securities regulator. This development represents a significant milestone for the cryptocurrency industry, challenging the perception of digital assets as risky investments.
As of today, the price of Bitcoin stands at $46,046.38, marking a slight decrease of 0.50%.
BTCUSD Daily Chart
The Players in the Market
Eleven spot Bitcoin ETFs, including BlackRock’s iShares Bitcoin Trust, Grayscale Bitcoin Trust, and ARK 21Shares Bitcoin ETF, commenced trading, instigating a fierce battle for market dominance. Leading the pack in trading volumes were Grayscale, BlackRock, and Fidelity, according to LSEG data.
Regulatory Approval and its Impact
The U.S. Securities and Exchange Commission finally gave the go-ahead for these products after a decade-long standoff with the crypto industry. However, SEC Chair Gary Gensler clarified that this approval does not constitute an endorsement of Bitcoin, labeling it as a “speculative, volatile asset.” Nevertheless, the launch of the ETFs bolstered Bitcoin’s price to its highest level since December 2021.
Fee Adjustments and Market Competition
The regulatory approval ignited intense competition among issuers, prompting some to reduce their product fees below the U.S. ETF industry standard even before the launch. Fees for the new Bitcoin ETFs vary from 0.2% to 1.5%, with several firms offering fee waivers for a specific duration or asset volume.
The World’s Largest Bitcoin ETF
Grayscale received the green light to transform its existing Bitcoin trust into an ETF, thereby instantaneously establishing the world’s largest Bitcoin ETF with over $28 billion in assets under management. Market participants keenly observed bid-ask spreads as the ETFs commenced trading.
Caution Amid Euphoria
Despite the excitement surrounding the approval, some analysts warned of potential premature euphoria. The broader investment community continues to perceive cryptocurrencies as risky, particularly in light of recent scandals such as the collapse of the FTX crypto exchange in 2022.
Crypto Stocks and Future Prospects
Crypto-related stocks initially surged but ended the day lower. However, many anticipate these products to set the stage for more innovative crypto ETFs, including spot ether products. Grayscale CEO Michael Sonnenshein revealed plans to file for a covered call ETF, enabling investors to generate income from options on its spot Bitcoin product.
What is a Bitcoin ETF?
A Bitcoin Exchange-Traded Fund (ETF) is an investment vehicle that tracks the performance of Bitcoin as an underlying asset. It’s a publicly traded fund that enables investors to gain exposure to Bitcoin’s price movements without directly owning the cryptocurrency. Bitcoin ETFs are similar to other ETFs that track assets like stocks, currencies, or precious metals. They operate as trusts managing pools of Bitcoin and issuing shares to investors.
How to Invest in a Bitcoin ETF
Investing in a Bitcoin ETF is a straightforward process, similar to investing in any other ETF or stock. After opening a brokerage account, you can place an order to purchase shares of the Bitcoin ETF. These shares represent a portion of the fund’s holdings in Bitcoin. The number of shares you can buy depends on the ETF’s current price and the amount you wish to invest.
Where to Buy a Bitcoin ETF
Bitcoin ETFs trade on traditional market exchanges rather than on cryptocurrency exchanges. Therefore, you can purchase Bitcoin ETFs through any brokerage firm that has access to these exchanges. Some popular online brokerage firms include those trading on NYSE Arca, an electronic securities exchange in the U.S.
How to Buy a Bitcoin ETF
To buy shares in a Bitcoin ETF, start by opening a brokerage account if you don’t already have one. Once your account is set up, use the ETF’s ticker symbol to search for it on your broker’s platform. Decide how many shares you want to buy, then place your order. Depending on your broker’s options, you may be able to place a market order (buying at the current market price) or a limit order (buying only when the ETF reaches a price you specify).
Other Market News
EUR/USD Consolidates Below 1.1000 Amid Subdued US Dollar
The EUR/USD currency pair has been consolidating its recent gains, maintaining a position below the 1.1000 mark. This comes as the US Dollar struggles due to expectations of a dovish approach from the Federal Reserve. However, escalating geopolitical tensions are restricting further upward movement for the pair. The upcoming release of producer inflation data from the US is now in the spotlight.
Thursday saw increased market volatility following the release of mixed inflation figures from the US. The Consumer Price Index (CPI) rose by 3.4% year-on-year in December, surpassing the market expectation of 3.2%. The Core CPI, which excludes volatile food and energy prices, matched analysts’ estimate with a monthly rise of 0.3%. Looking forward, the Producer Price Index (PPI) is predicted to increase by 1.3% in December. If this forecast is exceeded, concerns over stronger producer inflation could intensify, making it harder for the Fed to control consumer inflation and putting pressure on EUR/USD.
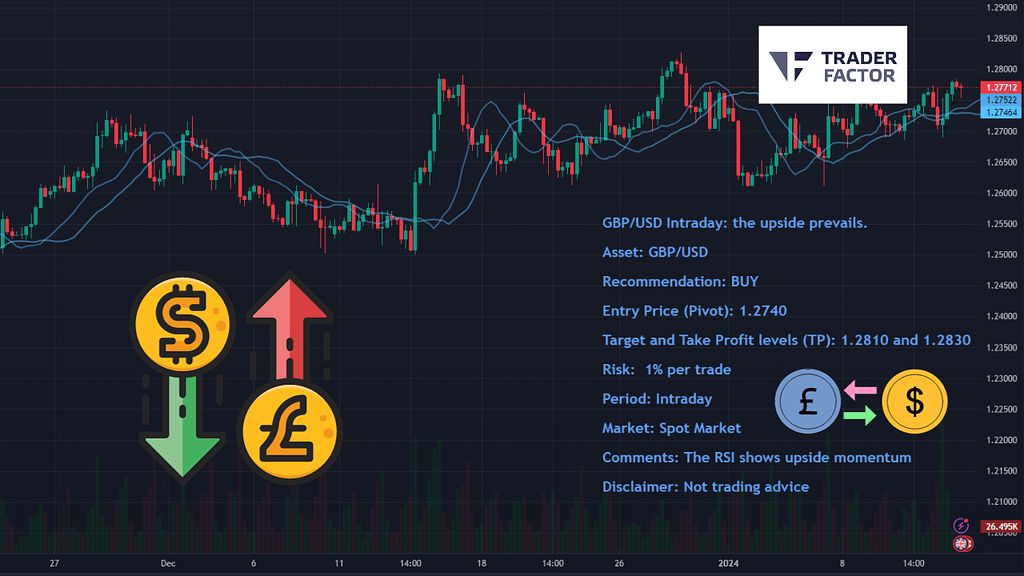
GBP/USD Holds Above 1.2750 After UK Data Release
The GBP/USD pair is trading within a narrow channel above 1.2750. Data from the UK revealed that the real GDP grew by 0.3% monthly in November, while Industrial Production contracted by 0.1% annually. Market attention now shifts to the upcoming release of US PPI data.
GBPUSD Daily Chart
UK Economy Sees Marginal Growth in November, Recession Fears Loom
The UK’s economy exhibited a slightly stronger than anticipated growth in November, but the threat of a recession looms large. This potential downturn could pose a significant challenge for Prime Minister Rishi Sunak ahead of the expected 2024 elections.
GDP Expands by 0.3% in November, Outpacing Predictions
The country’s Gross Domestic Product (GDP) saw a 0.3% expansion in November, recovering from a 0.3% drop in the previous month, according to data released by the Office for National Statistics (ONS).
Output Shrinkage and the Threat of Technical Recession
However, the economy’s output reduced by 0.2% in the three months leading up to the end of November, surpassing the expected 0.1% decline. The ONS suggests that a contraction or even stagnant output in December could result in a second successive quarter of declining output—signifying a technical recession.
Economic Challenges and the Impact on Sterling
“The lacklustre performance of the economy in November suggests the UK may well have slipped into a recession during the second half of 2023,” commented Ben Jones, an economist at the Confederation of British Industry. Following the release of the data, Sterling experienced a slight dip against the U.S. dollar.
Struggles Amid Rapid Inflation and High Interest Rates
Throughout 2023, the UK economy grappled with gaining momentum as households faced the pressures of rapid inflation and the highest Bank of England (BoE) interest rates in 15 years.
A Closer Look at November’s Economic Output
Data from Friday revealed that November’s economic output was marginally higher by 0.2% compared to a year ago and has only grown by 2.5% since 2019. “The longer-term picture remains one of an economy that has shown little growth over the last year,” stated ONS chief economist Grant Fitzner. However, he also noted, “GDP bounced back in the month of November, led by services with retail, car leasing and computer games companies all having a buoyant month.”
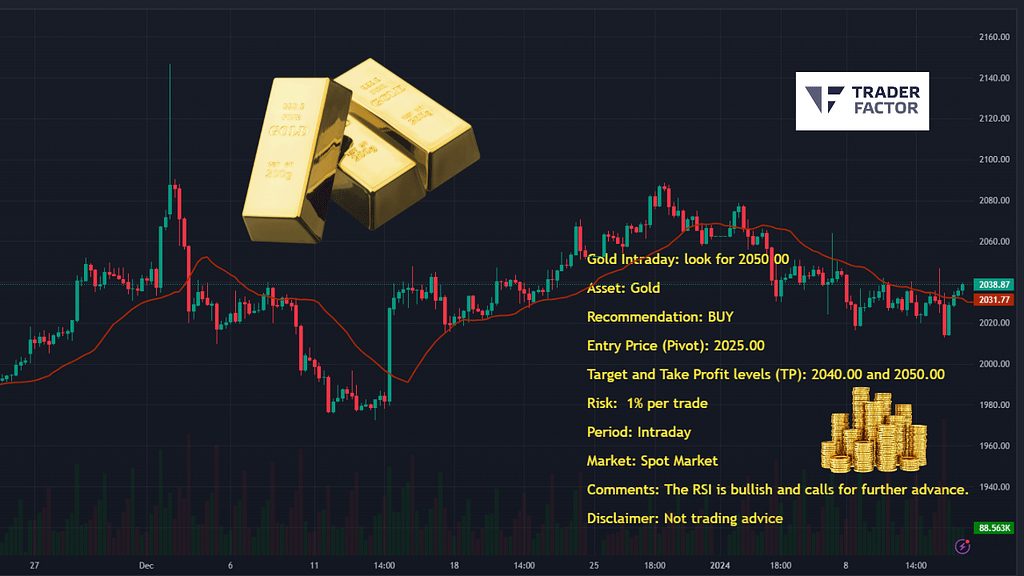
Gold Prices Boosted by Middle East Tensions, Awaiting US PPI Data
Gold prices have seen an upswing for the second consecutive day, benefiting from heightened safe-haven demand due to escalating geopolitical tensions in the Middle East. Despite this, the commodity remains below the $2,040-2,042 threshold, suggesting caution for investors given the uncertainty surrounding the Federal Reserve’s rate cut path.
XAUUSD Daily Chart
Disclaimer:
All information has been prepared by TraderFactor or partners. The information does not contain a record of TraderFactor or partner’s prices or an offer of or solicitation for a transaction in any financial instrument. No representation or warranty is given as to the accuracy or completeness of this information. Any material provided does not have regard to the specific investment objective and financial situation of any person who may read it. Past performance is not a reliable indicator of future performance.
Zahari Rangelov is an experienced professional Forex trader and trading mentor with knowledge in technical and fundamental analysis, medium-term trading strategies, risk management and diversification. He has been involved in the foreign exchange markets since 2005, when he opened his first live account in 2007. Currently, Zahari is the Head of Sales & Business Development at TraderFactor's London branch. He provides lectures during webinars and seminars for traders on topics such as; Psychology of market participants’ moods, Investments & speculation with different financial instruments and Automated Expert Advisors & signal providers. Zahari’s success lies in his application of research-backed techniques and practices that have helped him become a successful forex trader, a mentor to many traders, and a respected authority figure within the trading community.


 We provide Financial Market Analysis, Trading Education, and Reviews of only Regulated and the most Trusted Forex, CFD, and Crypto brokers.
.png)