| ||||||||
|

|

|

|

|

|

|

|

|

|

|


| ||||||||
|
|
|
|
|
|
|
|
|
|
|
 We provide Financial Market Analysis, Trading Education, and Reviews of only Regulated and the most Trusted Forex, CFD, and Crypto brokers.
The year 2023 was an extraordinary time for the forex markets, shaped by a series of important events that will continue to impact the industry in the years to come. From economic uncertainties to policy shifts and geopolitical tensions, the world of forex trading has seen many pivotal changes.

As we entered 2023, the world was still grappling with economic instability following two years of heavy inflation across Europe and North America, home to leading global currencies. This created a volatile market environment, with traders having to navigate unpredictable price movements and fluctuating exchange rates.
Throughout the year, several key developments further shaped the forex markets. The US economy experienced a surge, which likely influenced the valuation of the US Dollar (USD) and its relationship with other currencies.
One of the most significant events in the forex market in 2023 was the European Central Bank’s (ECB) hawkish bias. The ECB signaled a possible rate hike due to inflationary pressures. This led to the Euro gaining ground mid-year, as markets reacted to concerns about global growth trends. The ECB’s stance influenced trading strategies and shifted investor sentiment towards the Euro, which resulted in the currency’s appreciation against other major currencies.
As of November 20, 2023, multiple key events and news were impacting the price of the US Dollar. Among these, the Federal Reserve’s rate decisions stood out. The central bank took a cautious approach, keeping interest rates steady despite inflationary pressures. This decision bolstered the US dollar’s strength, leading to substantial gains over the year. The Federal Reserve’s cautious monetary stance provided a supportive backdrop for the greenback, helping it maintain its appeal amongst forex traders.
Forex expos and trade shows also had a significant impact on the forex market in 2023. These events provided platforms for traders, investors, and industry professionals to network and exchange ideas. Notable events included the iFX EXPO Asia in Bangkok, the MoneyShow in Las Vegas, Traders EXPO in Chicago, TradeTech FX in Paris, and The Trading Show Europe in London.
These events typically feature expert speakers, panel discussions, and networking opportunities, offering insights into the latest trends and developments in the forex market. They played a crucial role in shaping market sentiment and influencing trading strategies.
Global events like the Russia-Ukraine war and middle east tensions also played a significant role in shaping the forex markets. These events influenced market sentiment and led to significant shifts in currency valuations, creating both challenges and opportunities for forex traders.
In the world of forex trading, 2023 was a year marked by significant shifts and changes. Here we take a look at how some of the major currency pairs performed throughout the year.
The best performing forex pairs in 2023 were GBP/JPY, EUR/JPY, USD/JPY, GBP/USD, USD/CAD, EUR/USD, EUR/GBP, and USD/CHF. The Japanese Yen, British Pound, and US Dollar featured prominently in these pairs, indicating their strength and influence in the forex market.
In terms of trade volume, the most traded currency pairs were EUR/USD, USD/JPY, GBP/USD, and AUD/USD. The Euro and US Dollar pairing (EUR/USD) accounted for the highest percentage of trades, followed by USD/JPY and GBP/USD.
Volatility often provides traders with opportunities to profit from price fluctuations. In 2023, the Australian Dollar and Japanese Yen pairing (AUD/JPY) emerged as one of the most volatile currency pairs.
Additionally, other pairs such as EUR/USD, GBP/USD, and NZD/USD were highlighted as the best trending pairs when measuring trends with a moving average on a daily timeframe.
Certain months also stood out for trading specific currency pairs. In November, for instance, traders were encouraged to watch out for particular FX currency pairs, while August saw the EUR/USD as one of the best currency pairs to trade.
In 2023, the crypto market experienced a series of significant developments that shaped its trajectory. From Bitcoin’s rally to the growth of regulated derivatives venues, let’s dive into the highlights of the crypto market in the past year.
Bitcoin, the leading cryptocurrency, had quite the year in 2023. After rebounding from a low of almost $16,000, it hit a high of $44,500. As of October 31, 2023, Bitcoin was trading at $34,497.
Ethereum, the second-largest cryptocurrency by market cap, also saw considerable movement in 2023. It was trading at $1,808 as of October 31, 2023.
Bitcoin, the leading cryptocurrency, saw a significant rise in its price throughout December. The month started with Bitcoin trading around $43,757.96. However, the price of Bitcoin fluctuated throughout December, reaching a high of $44,202.18, and closing the month at $42,156.90.
This represented an increase of 11.8% for the month. Analysts predicted that Bitcoin would reach a price of $46,315 by December 16, 2023, but it fell short of this target.
While Bitcoin continued to be the most talked-about cryptocurrency, other digital assets also experienced noteworthy movements. Solana (SOL), for instance, had a predicted minimum price of around $20.24 in 2023. Meanwhile, Ethereum surged from about $11 to around $2,217 from April 2016 to the end of December 2023.
Data from 2023 suggests that a crypto bull market began that year and is set to continue throughout 2024. This trend was not limited to Bitcoin and Ethereum but extended to other cryptocurrencies as well.
For crypto bulls, the most lucrative bets in 2023 were in the stock market. Shares of Coinbase and other related stocks surged alongside the rally in Bitcoin.
The total crypto market cap rebounded from below $1 trillion in mid-2022 to surpass $1.5 trillion by December 2023.
In 2023, the crypto market saw a growth of regulated, centrally-cleared derivatives venues, including Coinbase Derivatives, CBOE, Eurex, GFO-X, and others. Goldman Sachs pointed out that 2023 was the year that crypto markets became institutionalized.
One of the most significant developments in 2023 was the arrival of Bitcoin ETFs. Bitcoin ETFs are financial products that track the price of Bitcoin and trade on traditional stock exchanges. This means you can buy and sell shares of a Bitcoin ETF just like you would with any other ETF or individual stock. The aim is to provide investors with exposure to Bitcoin without the need to directly purchase, store, or manage the digital asset.
A spot Bitcoin ETF would allow investors to directly invest in actual Bitcoin, rather than Bitcoin futures contracts. This could provide retail investors with greater exposure to the world’s largest cryptocurrency at less cost than the already approved futures-based Bitcoin ETFs.
The introduction of Bitcoin ETFs holds immense opportunities for both Bitcoin and the broader digital asset ecosystem. It could open up access to Bitcoin for mainstream investors who may have been wary of investing directly in cryptocurrencies due to their volatility and the complexities of digital asset management. Furthermore, Bitcoin ETFs could drive significant capital into Bitcoin, potentially boosting its price.
However, some experts warn that the hopes tied to Bitcoin ETFs might be overestimated. While the launch of Bitcoin ETFs is seen as a positive step towards the integration of cryptocurrencies into the mainstream financial system, it might not immediately lead to the massive inflow of capital that some are expecting.
Bitcoin ETFs are set to play a key role in the future of the crypto market. They could potentially make Bitcoin more accessible to a broader range of investors, including those with retirement accounts like 401(k)s and IRAs. This could lead to an influx of new capital into the crypto market, driving further growth and innovation.
In terms of revenue, the cryptocurrencies market was projected to reach US$40.7 billion in 2023. The market is expected to show an annual growth rate (CAGR 2023-2028) of 11.98%.
In a nutshell, 2023 was a transformative year for the crypto market, marked by bullish trends, increased institutionalization, and significant growth in market cap. As we step into 2024, these developments are likely to continue influencing the trajectory of the crypto market.
The year 2023 was a remarkable one for gold prices, with the precious metal staging an impressive comeback after two lackluster years.
XAUUSD One Year Chart
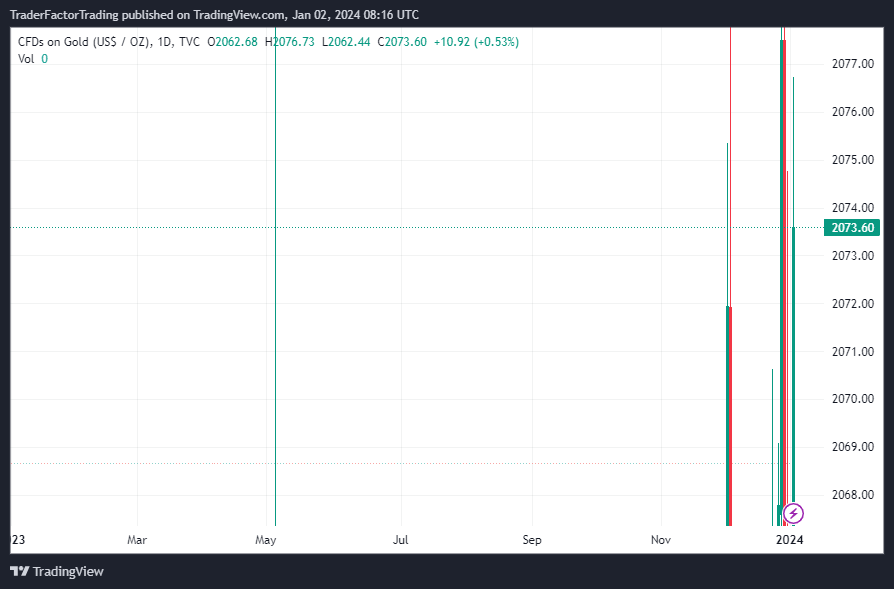
Throughout 2023, gold saw significant gains. On December 19, 2023, the price of gold rose from $1,839.01 per ounce to $2,030.11, marking a 10.39% increase. This surge in price was due to a combination of economic and geopolitical uncertainties, which typically drive investors towards safe-haven assets like gold.
In the latter part of the year, gold prices reached new record highs. Prices for the yellow metal jumped as much as 3% in Monday trade to reach $2,135 per ounce, surpassing the previous record of $2,072. Furthermore, by early December, gold prices touched $2,100 an ounce, setting a new record high.
Looking ahead, analysts are optimistic about gold’s price trajectory. According to long-term forecasts, gold prices are projected to hit $2,400 by the end of 2025 and then $2,700 by the end of 2026. Some even suggest that gold could rise to $3,000 within the same period.
2023 was a standout year for gold prices. The precious metal’s impressive performance can be attributed to various factors, including economic and geopolitical uncertainties. As we move into 2024, it will be interesting to see how gold prices evolve in response to ongoing global developments.
Silver showed a strong performance in the year 2023, rallying by 33% in the last two months. However, it’s not all smooth sailing. With the prospect of a hawkish Federal Reserve and technical upside appearing stretched, profit-taking may emerge.
On January 1, 2024, the price of silver was $24 per ounce, down 0.87% from the previous day’s price. Despite this slight dip, silver prices had been on an upward trend, rising over 2% in European trade on the last Monday of 2023 and reaching a three-month high.
Oil prices in 2023 were subject to a number of influences, including geopolitical tensions, changes in supply and demand dynamics, and the middle east tensions.
The stock market saw impressive gains in 2023.
The Nasdaq Composite, known for its significant tech representation, had a volatile year in 2023, but it ended the year on a high note. On January 1, 2024, the Nasdaq Composite index stood at 15,026.49, although it slipped 0.45% from the previous trading day.
The Dow Jones Industrial Average (DJIA) also experienced volatility throughout 2023. However, despite some setbacks, it managed to finish the year strong. As of January 1, 2024, the Dow Jones stood at 37,673.27, marking a minor decrease of 0.10% from the previous trading session.
Few stocks had better years than Nvidia, which saw a phenomenal increase in its stock value. Nvidia (NVDA) gained an impressive 246% in 2023. This surge was driven by the demand for AI chips spurred by the launch of ChatGPT. The California-based chipmaking giant’s shares soared, making it the top-performing S&P 500 stock in 2023.
In addition to Nvidia, several other stocks had outstanding performances in 2023. Meta (META) gained 184%, and Tesla (TSLA) soared by 130%. These stocks showed a remarkable recovery after slumping by more than 50% in 2022.
Looking forward, analysts foresee a gigantic 785.3% growth in Q3 earnings for Nvidia to $3.01 per share. For the full fiscal year 2024, EPS could jump 289.4%. While the forecasted Nvidia price at the end of 2023 was $536, with a year to year change of +267%, the rise from that day to year-end was expected to be +15%.
While 2023 was a strong year for many stocks, not all companies enjoyed the same level of success. A few notable underperformers included:
Peloton (PTON), the home fitness company, faced a challenging year in 2023. The stock dropped by nearly 75% over the course of the year. This was largely due to the easing of pandemic-related restrictions, which led to a decrease in demand for home workout equipment.
Similar to Peloton, Zoom (ZM) also struggled in 2023. As businesses and schools started reopening and people began returning to their normal routines, the demand for Zoom’s video conferencing services declined. The stock fell by about 60% over the year.
Robinhood (HOOD), the popular trading app, faced significant challenges in 2023. Regulatory issues and a slowdown in trading activity contributed to a decline in the company’s stock price, which fell by around 50% during the year.
While these were some of the most notable underperformers in 2023, it’s important to note that the stock market is inherently volatile and performance can vary greatly from year to year.
Disclaimer:
All information has been prepared by TraderFactor or partners. The information does not contain a record of TraderFactor or partner’s prices or an offer of or solicitation for a transaction in any financial instrument. No representation or warranty is given as to the accuracy or completeness of this information. Any material provided does not have regard to the specific investment objective and financial situation of any person who may read it. Past performance is not a reliable indicator of future performance.
FOLLOW US
 We provide Financial Market Analysis, Trading Education, and Reviews of only Regulated and the most Trusted Forex, CFD, and Crypto brokers.

