

Learn how Candle Range Theory (CRT) identifies liquidity sweeps, false breakouts and institutional market moves. Includes Forex, Gold, step-by-step examples, FAQs and trading tips.
%20Strategy%20Explained%20How%20to%20Trade%20Liquidity%20Sweeps%20in%20Forex%20&%20Gold%20(2026%20Guide).png)
📌 Candle Range Theory at a Glance
| Feature | Details |
|---|---|
| Strategy | Candle Range Theory (CRT) |
| Primary Focus | Liquidity Sweeps & False Breakouts |
| Best Markets | Forex, Gold, NAS100, US30 & Bitcoin |
| Best Timeframes | M5, M15, H1 & H4 |
| Trading Style | Scalping, Day Trading & Swing Trading |
| Difficulty | Beginner to Intermediate |
| Core Concepts | Accumulation, Manipulation & Distribution |
| Confirmation | MSS, BOS, CHoCH, FVG & Order Blocks |
| Recommended Risk | 1–2% per trade |
| Ideal Risk-to-Reward | 1:2 to 1:5 |
Candle Range Theory (CRT) Strategy Explained: How to Trade Liquidity Sweeps in Forex & Gold (2026 Guide)
Have you ever watched a trade hit your stop loss by a single pip, only to immediately reverse and go exactly where you predicted? It’s not bad luck, it’s liquidity.
The Candle Range Theory (CRT) strategy isn’t just about reading green and red bars; it’s about understanding the narrative of money flow. By analyzing the specific range of a candle, its wicks, body, and relationship to the previous candle, traders can spot where institutional money is trapping retail traders (the “manipulation”) before the real move happens.
This guide moves beyond textbook definitions. We’re breaking down how to actually trade CRT using real market logic, concrete examples from Gold and EUR/USD, and actionable steps you can apply to your charts today.
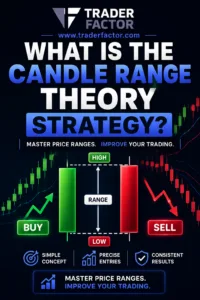
What You’ll Learn in This Guide
- What Candle Range Theory (CRT) is and why it works
- The three phases of CRT: Accumulation, Manipulation, Distribution
- How to spot liquidity sweeps and false breakouts
- Step-by-step CRT trading strategy for Forex and Gold
- Best times to trade CRT (London/New York sessions)
- Common mistakes and how to avoid them
- CRT cheat sheet for quick reference
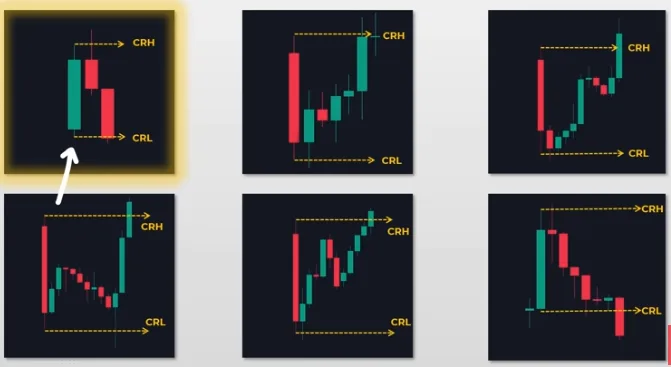
- 🔍 Analyze Candlestick Ranges: CRT focuses on studying candlestick ranges and wicks to predict market behavior, identifying trends, reversals, or consolidations.
- 💧 Liquidity Sweeps: Wicks often show where liquidity is “swept” as large players and institutions trigger stop-losses or trap traders before reversing price direction.
- 📊 Phases of CRT: Key phases include Accumulation (low volatility, narrow ranges), Manipulation (erratic wicks, false signals), and Distribution (wide ranges, trend reversals).
- 🛠️ Practical Tools: Combine CRT with support/resistance levels, volume data, and indicators to confirm breakouts, reversals, and manage risk effectively.
📘 What is Candle Range Theory?
Candle Range Theory (CRT) is a Smart Money trading strategy that identifies liquidity sweeps, false breakouts, and institutional market manipulation to find high-probability trade entries in Forex, Gold, indices, and crypto markets.
⚡ How Does CRT Work?
CRT waits for a liquidity sweep, confirms a market structure shift, and enters after the manipulation phase. Traders follow institutional money instead of chasing breakout traders.
💧 What is a Liquidity Sweep?
A liquidity sweep is a temporary move above highs or below lows that triggers stop losses before price reverses. Institutions use it to collect liquidity before the real market move.
⚖️ CRT vs Other Trading Strategies
| Strategy | Focus | Best For |
|---|---|---|
| CRT | Liquidity sweeps & false breakouts | Precision entries & reversals |
| Supply & Demand | Order blocks & demand zones | Swing & position trading |
| ICT / Smart Money | Market structure & liquidity | Advanced price action |
| Support & Resistance | Key price levels | All trading styles |
📋 CRT Strategy Cheat Sheet
| Phase | What Happens | Trader Action |
|---|---|---|
| Accumulation | Narrow range, low volatility, small candles | 📍 Mark highs & lows. Wait patiently. |
| Manipulation | False breakout, liquidity sweep, long wicks | 👀 Watch for rejection. Don’t enter yet. |
| Distribution | Strong directional move, expansion candles | ✅ Enter on confirmation. Manage the trade. |
What is Candle Range Theory (CRT)?
At its core, Candle Range Theory focuses on the range of a specific candlestick (high to low) to predict future price delivery. Unlike standard price action which looks at patterns like “head and shoulders,” CRT looks at liquidity mechanics.
It operates on the belief that every candle tells a story of three phases:
- Accumulation: Building positions.
- Manipulation: Inducing traders into the wrong side (liquidity sweep).
- Distribution: The true directional move.
When you master CRT, you stop chasing price and start waiting for the market to “show its hand” via a liquidity sweep.
Why CRT Matters for AI and Algorithmic Trading
Institutional algorithms (AI) drive modern markets. They seek liquidity to fill large orders. CRT is essentially a roadmap of where these algorithms are likely to trigger orders. By aligning with CRT, you are aligning with the “smart money” logic that dominates 80% of daily volume.
The Three Phases of CRT: The Anatomy of a Move
To trade CRT effectively, you must identify where you are in the cycle. This cycle repeats on all timeframes, from the 1-minute chart to the Monthly chart.
1. Accumulation Phase
This is the setup. Markets are quiet, ranges are narrow, and volatility is low.
- What it looks like: Small bodied candles, consolidating near a key level (Support/Resistance).
- The Trap: Impatient traders get bored or try to predict a breakout too early.
- Action: Do nothing. Wait.
2. Manipulation Phase (The “Judas Swing”)
This is the fake-out. The price aggressively moves in one direction, breaking a short-term high or low.
- What it looks like: A sudden spike or drop that triggers stop losses (liquidity) resting above or below the accumulation range.
- The Trap: Breakout traders jump in, thinking the trend has started.
- Action: Watch for a “Liquidity Sweep.” If the candle wicks aggressively and fails to close beyond the range, reversal is imminent.
3. Distribution Phase
This is the payoff. After the liquidity is swept, the price reverses and moves rapidly in the intended direction.
- What it looks like: Expansion candles with large bodies moving away from the manipulation zone.
- The Trap: Trying to enter too late after the move has already expanded.
- Action: Enter on the confirmation of the reversal.
| Phase | Market Behavior | Trader Psychology | Action to Take |
|---|---|---|---|
| Accumulation | Tight range, low volume | Boredom, Indecision | Mark Highs & Lows |
| Manipulation | Sudden spike/drop (False Break) | FOMO, Panic | Wait for Wick Rejection |
| Distribution | Strong directional move | Regret (if missed), Relief | Execute/Hold Trade |

Bullish CRT Setup (The “Bear Trap”)
- Context: Market is near support.
- The Setup: A bearish (red) candle forms.
- The Sweep: The next candle dips below the low of the previous candle. This triggers sell stops.
- The Reversal: The price rejects the low, leaving a long lower wick, and closes bullish (green) or inside the previous range.
- Result: The market rallies.
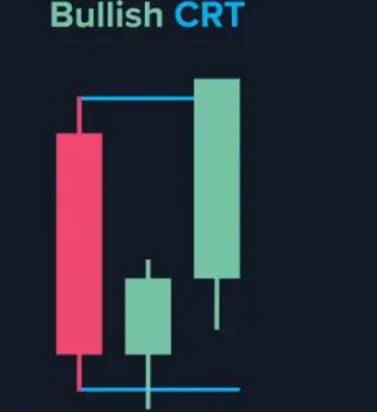
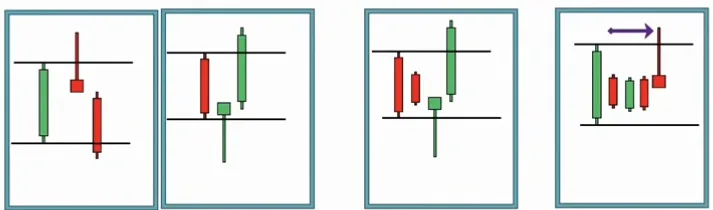
First Candle (Bearish/Red): The first candle is bearish, closing lower than it opened. This creates a low point (support level) that attracts attention from traders, especially those placing stop-losses below it.
Second Candle (Liquidity Sweep): The second candle dips below the low of the first red candle with its wick. This “sweeps the liquidity” by triggering stop-losses of buyers or enticing sellers to enter short positions, thinking the downtrend will continue.
Reversal Signal: Instead of closing lower, the second candle reverses direction and closes higher, forming a bullish signal. The long lower wick shows rejection of lower prices, indicating that buyers have stepped in and taken control.
A bullish CRT setup indicates upward price momentum, often signaling that buyers are in control. Here’s how it unfolds:
Accumulation Phase
- Narrow candlestick ranges appear after a downtrend or during consolidation.
- This phase reflects institutional traders quietly building long positions.
- Example: A series of small-range candles near a support level.

Manipulation Phase:
- A sudden downward wick (liquidity sweep) may occur to trigger stop-losses below support, trapping sellers.
- This is followed by a strong bullish candle, signaling a reversal.
Distribution Phase:
- Candlesticks with expanding ranges and strong bullish bodies indicate upward momentum.
- Example: Three consecutive bullish candles with increasing ranges (the “Power of Three”) confirm a bullish trend.
Key Signal: Long lower wicks during accumulation or manipulation phases often suggest rejection of lower prices, hinting at bullish sentiment.
Bearish CRT Setup (The “Bull Trap”)
- Context: Market is near resistance.
- The Setup: A bullish (green) candle forms.
- The Sweep: The next candle spikes above the high of the previous candle. This triggers buy stops.
- The Reversal: The price rejects the high, leaving a long upper wick, and closes bearish.
- Result: The market drops.
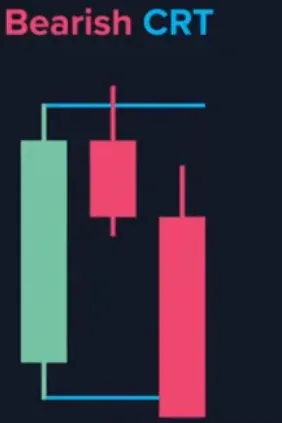
First Candle (Bullish): The first candle is bullish, meaning it closes higher than it opens, showing upward momentum. This candle might attract buyers who expect the price to continue rising.
Second Candle (Liquidity Sweep): The second candle “sweeps the liquidity” above the high of the first bullish candle. This means its wick extends above the first candle’s high, triggering stop-loss orders of traders who went short or enticing breakout traders to go long.
Reversal Signal: Instead of continuing upward, the second candle reverses direction. The long wick above the first candle’s high shows rejection of higher prices, signaling that sellers have taken control. This is often a sign of a potential bearish reversal.
A bearish CRT setup signals downward price momentum, where sellers dominate. Here’s how it plays out:
Accumulation Phase:
- Narrow candlestick ranges appear after an uptrend or during consolidation.
- This phase reflects institutional traders preparing to short the market.
- Example: Small-range candles near a resistance level.
Manipulation Phase
- A sudden upward wick (liquidity sweep) may occur to trigger stop-losses above resistance, trapping buyers.
- This is followed by a strong bearish candle, signaling a reversal.
Distribution Phase
- Candlesticks with expanding ranges and strong bearish bodies indicate downward momentum.
- Example: Three consecutive bearish candles with increasing ranges confirm a bearish trend.
Key Signal: Long upper wicks during accumulation or manipulation phases often suggest rejection of higher prices, hinting at bearish sentiment.
CRT is not limited to basic candlestick analysis; it involves integrating other technical factors. These include support and resistance levels, trend direction, and volume data. By doing so, traders create a more complete picture of market behavior. The strategy’s simplicity and adaptability make it a practical choice for those exploring forex candlestick patterns.
How the CRT Strategy Applies to Forex
Forex traders often seek strategies that adapt to various market conditions. The Candle Range Theory forex strategy fits this perfectly. It works well in trending and range-bound scenarios, offering insights into short- and long-term price movement.
Take euro-dollar (EUR/USD) trading as an example. If the daily candlestick shows a narrowing range after a strong trend, this could indicate consolidation. Using CRT, you might interpret this as a sign of an impending breakout or reversal. This analysis minimizes guesswork during uncertain periods.
Furthermore, it complements other trading tools like moving averages or RSI. Combining these with CRT provides confirmation signals, increasing the strategy’s effectiveness. This strategic layering ensures your forex technical analysis remains grounded in objective data.
Applying CRT to Gold Trading
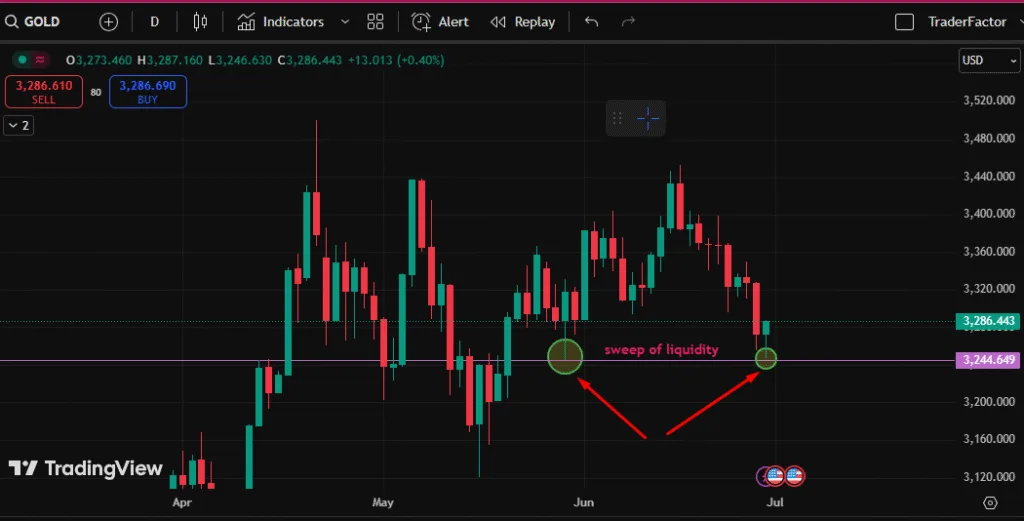
The CRT strategy is particularly interesting for gold trading, a market known for its volatility. Gold’s price often reacts to geopolitical risks or economic shifts, creating large candlestick ranges. Currently trading above $3200, it’s a prime candidate for CRT analysis.
In this 1-day gold chart, you can see the first long wick which indicates that’s an area of liquidity. The liquidity is swept at exactly the same price level and price reverses upwards as shown in the lower time frame chart.
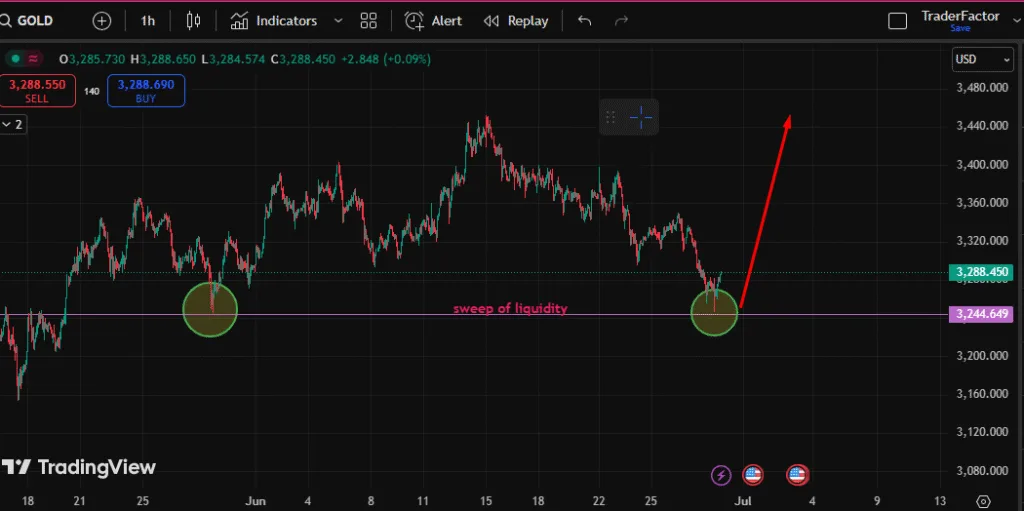
1-minute chart
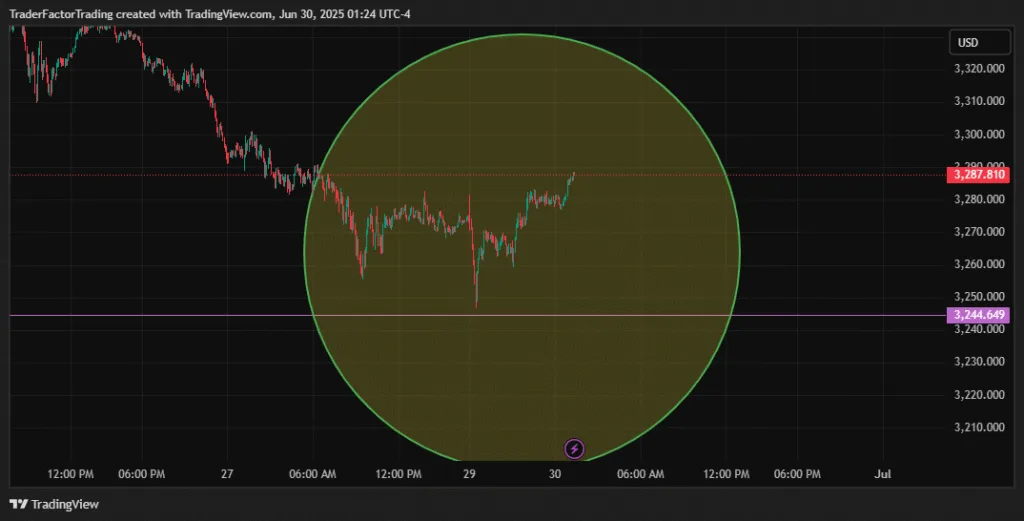
There’s a liquidity sweep and an instant reversal as shown in the 1-minute chart
More Examples
Gold 1-day Chart
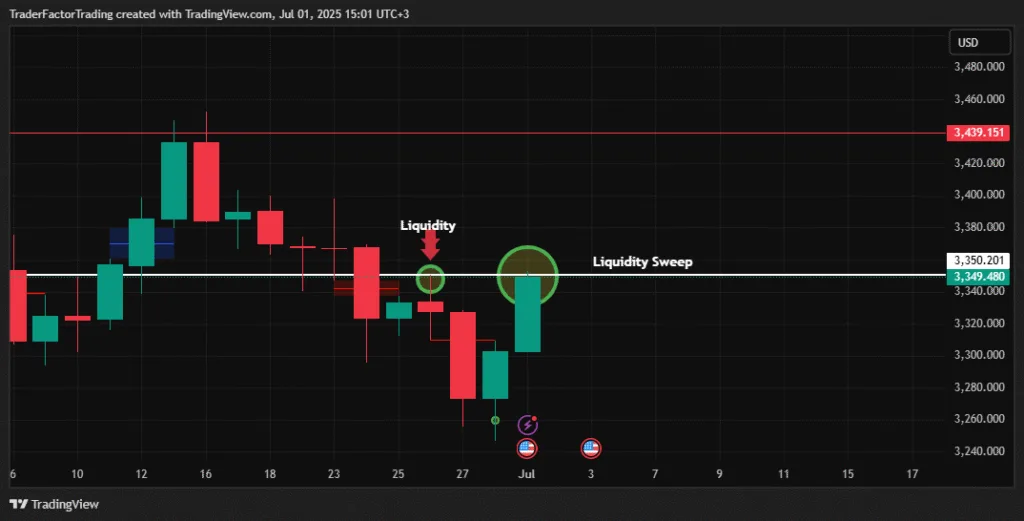
Liquidity spotted on the 1-day chart at 3350.201 represented by a bearish red candle with a longer upper and lower wick and small body (long-legged doji). Notice how price reverses as shown in the following 1-minute candle after sweeping the liquidity.
Gold 1-minute chart
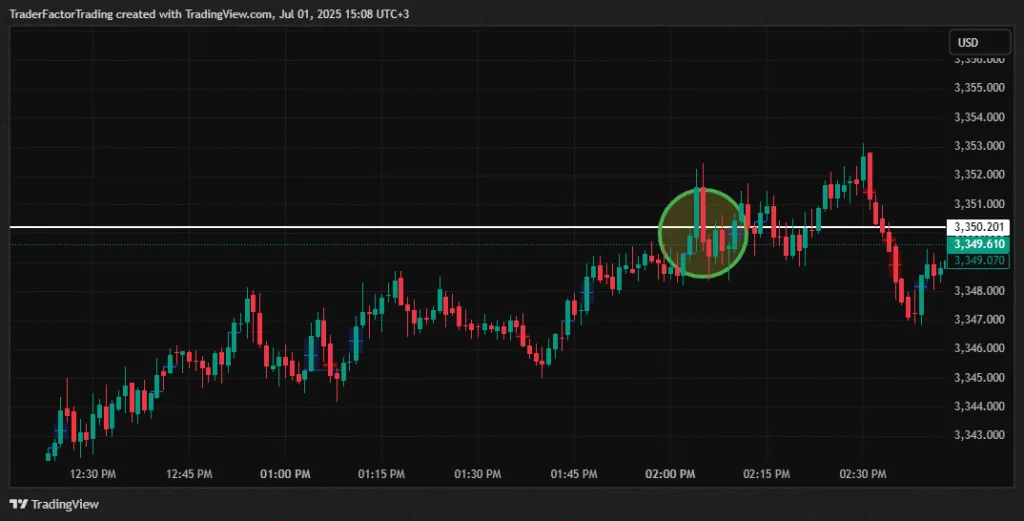
However its important to note that, CRT supports more than directional trading. It aids risk management too. For example, you can place stop-loss orders based on the candle’s range to limit potential losses. This aligns with the strategy’s goal of minimizing risk while seizing opportunities.
Trading Candle Range Theory Across Different Markets
One of the greatest strengths of Candle Range Theory (CRT) is its versatility. Because the strategy is built around liquidity, market manipulation, and institutional order flow rather than a specific asset, it can be applied to Forex, indices, commodities, cryptocurrencies, and even stocks. The key is understanding how different markets behave and adjusting your expectations accordingly.
Candle Range Theory for NAS100
The NAS100 is one of the most volatile equity indices, making it an excellent market for CRT traders. Institutional traders frequently sweep liquidity above previous highs or below recent lows before initiating strong directional moves.
When trading NAS100:
- Wait for liquidity to be taken above or below a recent swing.
- Look for a strong rejection candle following the sweep.
- Confirm with a Market Structure Shift (MSS).
- Enter after price retraces into the manipulation candle or an imbalance.

Since NAS100 can move hundreds of points within a single session, traders should avoid entering during the accumulation phase and instead wait for confirmation that manipulation has already occurred.
Best Timeframes: M5, M15, H1
Best Sessions: London Open and New York Open
Candle Range Theory for US30 (Dow Jones)
The US30 often creates aggressive stop hunts before major trends begin. Its sharp price movements make patience essential, as entering too early can lead to unnecessary losses.
A typical CRT setup on US30 involves:
- Identifying a consolidation range.
- Waiting for price to break beyond the range and trigger stop losses.
- Watching for a rapid reversal back inside the range.
- Entering after confirmation from market structure.
Because US30 is highly volatile, wider stop losses may be required compared to major Forex pairs.
Best Timeframes: M15, H1
Candle Range Theory for Bitcoin
Bitcoin is well known for liquidity grabs, false breakouts, and rapid price reversals. These characteristics make it particularly suitable for Candle Range Theory.
Unlike traditional markets, Bitcoin trades 24 hours a day. Liquidity sweeps can occur during any trading session, although volatility typically increases when the London and New York sessions overlap.

CRT traders should focus on:
- Previous daily highs and lows.
- Weekly liquidity pools.
- Psychological price levels.
- Weekend fake breakouts.
Because cryptocurrency markets can move quickly, waiting for confirmation before entering a trade is especially important.
Best Timeframes: M15, H1, H4
CRT for M1 Scalping
Many traders use Candle Range Theory for scalping on the one-minute chart. While opportunities are frequent, lower timeframes also generate more false signals.
To improve accuracy:
- Use the M15 or H1 trend as your directional bias.
- Wait for a clear liquidity sweep on M1.
- Confirm with a break in market structure.
- Enter only after the manipulation phase has finished.
- Keep stop losses tight and target nearby liquidity.
Scalping requires discipline, fast execution, and strict risk management. Beginners are generally better served by starting on the M15 or H1 timeframe before moving to M1.

Trading CRT During the London Session
The London trading session produces some of the highest liquidity in the Forex market. Institutional traders frequently create false breakouts shortly after the market opens as they build positions.
Common CRT opportunities include:
- Liquidity sweeps during the first one to two hours after the London Open.
- Reversals from the Asian session high or low.
- Breakouts that quickly fail before the real trend begins.
Major currency pairs such as EUR/USD, GBP/USD, and GBP/JPY tend to perform particularly well during this session.
Trading CRT During the New York Session
The New York session brings another wave of institutional participation, particularly after U.S. economic news releases.
CRT setups often develop around:
- High-impact news events.
- Previous London highs and lows.
- Opening Range Breakouts.
- New York session liquidity grabs.
Gold (XAU/USD), NAS100, US30, and USD currency pairs frequently experience strong CRT opportunities during this period.

Trading CRT During the Asian Session
The Asian session usually has lower volatility than London and New York. Rather than producing large trends, it often creates consolidation ranges that become liquidity targets later in the day.
CRT traders commonly:
- Mark the Asian session high and low.
- Wait for London to sweep one side of the range.
- Trade the reversal after confirmation.
This simple approach is widely used by intraday traders looking to capitalize on London session manipulation.
Multi-Timeframe CRT Analysis
One of the most effective ways to improve CRT performance is to combine multiple timeframes. This helps traders align short-term entries with the broader market trend.
A common workflow includes:
- Identify the overall trend on the Daily chart.
- Refine directional bias using the H4 or H1 timeframe.
- Locate liquidity zones on the M15 chart.
- Execute entries on the M5 or M1 chart after confirmation.
Using multiple timeframes reduces the likelihood of trading against institutional momentum while improving entry precision.

Common CRT Confirmation Signals
Although liquidity sweeps are the foundation of Candle Range Theory, experienced traders rarely enter a trade based on this signal alone. Instead, they look for additional confirmation.
Some of the strongest confirmation signals include:
- Market Structure Shift (MSS)
- Break of Structure (BOS)
- Change of Character (CHoCH)
- Strong rejection candles
- Fair Value Gap (FVG)
- Order Blocks
- Increasing trading volume
- Momentum divergence
- Retest of the manipulation candle
- Confluence with key support and resistance
The more confirmation signals that align, the higher the probability of a successful trade.

Optimizing Risk-to-Reward with CRT
Successful CRT trading is not about winning every trade—it’s about ensuring that winning trades outweigh losing ones. Maintaining a favourable risk-to-reward ratio is one of the easiest ways to improve long-term profitability.
Consider these best practices:
- Risk no more than 1–2% of your account on a single trade.
- Aim for a minimum risk-to-reward ratio of 1:2.
- Whenever possible, target 1:3 or higher.
- Place stop losses beyond the liquidity sweep rather than inside the consolidation range.
- Take partial profits at key liquidity levels.
- Move your stop loss to breakeven once price has moved significantly in your favour.
- Avoid chasing trades after the manipulation phase has already completed.
By combining disciplined risk management with high-quality CRT setups, traders can remain profitable even if only a portion of their trades are successful.
Best Markets for Candle Range Theory
| Market | Difficulty | Volatility | Recommended Timeframes |
|---|---|---|---|
| EUR/USD | Beginner | Medium | M15, H1 |
| GBP/USD | Beginner–Intermediate | High | M15, H1 |
| Gold (XAU/USD) | Intermediate | Very High | M5, M15, H1 |
| NAS100 | Intermediate | Very High | M5, M15 |
| US30 | Intermediate | Very High | M15, H1 |
| Bitcoin (BTC/USD) | Intermediate | Very High | M15, H1, H4 |
Key Takeaway
Candle Range Theory is a flexible trading methodology that can be adapted to nearly every financial market. Whether you trade Forex, Gold, stock indices like NAS100 and US30, or cryptocurrencies such as Bitcoin, the core principles remain the same: identify liquidity, wait for manipulation, confirm the reversal, and manage risk effectively. When combined with multiple timeframe analysis, session awareness, and disciplined risk-to-reward management, CRT becomes a powerful framework for identifying high-probability trading opportunities across a wide range of market conditions.

Evaluating the CRT Indicator
On platforms like TradingView, the Candle Range Theory indicator can make analysis more straightforward. This tool calculates candle ranges automatically, saving you time while increasing accuracy. The indicator works well as an add-on, enhancing forecasting power while reducing manual calculations.
For instance, if the CRT indicator identifies consistent narrowing ranges during Asian trading hours, you might anticipate reduced volatility. Conversely, wider ranges during London or New York sessions often suggest significant price action. Understanding what time to trade Candle Range Theory is vital for optimizing its application.
Despite these advantages, remember that no strategy guarantees accuracy. CRT’s win rate depends on factors like market conditions and execution discipline. Traders should backtest the strategy using historical data to evaluate performance before full implementation.
Power of Three
A critical component of CRT is the Power of Three (PO3). While phases describe the cycle, PO3 describes the candle structure itself.
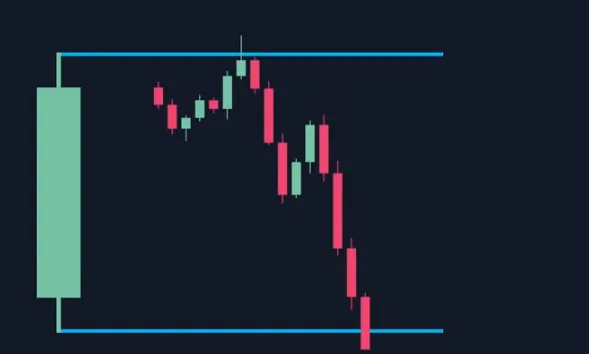
If you look at a Daily bullish candle, the wick at the bottom is often the Manipulation phase occurring on a lower timeframe (like the 1-hour chart).
Close: Price closes near the high.
Open: Price opens (Accumulation).
Low: Price drops to create the low of the day (Manipulation/Judas Swing).
High: Price rallies to the high of the day (Distribution).
Actionable Insight: If you are bullish on the day, do not buy at the open. Wait for the drop (Manipulation) below the opening price. That discount is your entry.
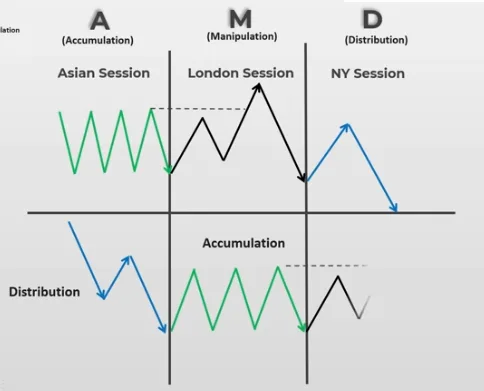
In the Candle Range Theory (CRT), the concepts of accumulation, manipulation, and distribution are critical for understanding market behavior and identifying trading opportunities. These phases represent the market’s cyclical nature and help traders anticipate price movements by analyzing candlestick ranges and patterns.
Accumulation Phase in CRT
The accumulation phase occurs when the market consolidates after a downtrend or during periods of low volatility. In this phase, institutional traders or large market participants quietly build their positions without causing significant price movement. Candlestick ranges during accumulation are typically narrow, reflecting indecision or low trading activity.
For example, in gold trading, if gold shows a series of small-range candles after a sharp decline, it could indicate accumulation. CRT traders might interpret this as a signal that the market is preparing for a potential upward breakout. By analyzing the candlestick ranges and combining them with support levels, you can identify when the accumulation phase is nearing its end.
Manipulation Phase in CRT
The manipulation phase is where market makers or large players create false signals to mislead retail traders. This phase often involves sudden spikes or dips in price, leading to stop-loss hunting or trapping traders in the wrong direction. Candlestick ranges during manipulation are often erratic, with long wicks and unpredictable movements.
For instance, in forex trading, if the EUR/USD pair shows a sudden large-range bearish candle followed by a quick recovery, it could be a manipulation move. CRT traders use this phase to remain cautious and avoid entering trades prematurely. By waiting for confirmation through consistent candlestick patterns, you can avoid falling victim to these deceptive moves.

Distribution Phase in CRT
The distribution phase occurs after an uptrend, where institutional traders begin offloading their positions. This phase is characterized by increased volatility and wider candlestick ranges as the market transitions from bullish to bearish sentiment. Distribution often signals the end of a trend and the beginning of a reversal.
For example, in gold trading, if you observe a series of large-range candles with long upper wicks near a resistance level, it could indicate distribution. CRT traders might use this as a signal to prepare for a potential downtrend. By analyzing the candlestick ranges and combining them with resistance levels, you can identify when the distribution phase is complete.
Practical Example
Gold 1-day Chart Presentation
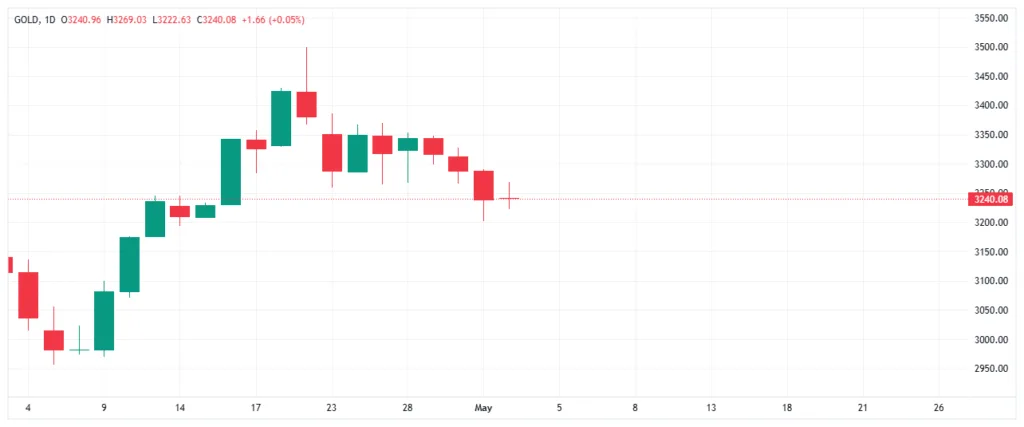
The above chart represents gold trading where the following scenarios unfolded.
- Current Day’s Candle (Inverted Cross): The thin body with a long upper wick and short lower wick indicates indecision in the market. Buyers attempted to push prices higher but failed to sustain the momentum, as sellers regained control by the close. This often signals a potential reversal or continuation of bearish sentiment, depending on the context.
- Previous Day’s Candle (Long Lower Wick): The prior red candle with a 3/4 body and a long lower wick suggests strong selling pressure during the session, but buyers stepped in to push prices off the lows. This could indicate that the market is testing support levels.
CRT Strategy Expectation for Tomorrow
Given these patterns, tomorrow’s movement will likely depend on how the market reacts to the current indecision:
- Bearish Scenario: If tomorrow opens below the current day’s low and forms a larger red candle, it could confirm a continuation of the downtrend. This would align with the bearish momentum seen in the previous two days.
- Bullish Scenario: If tomorrow opens above the current day’s high and forms a green candle with a strong body, it could signal a reversal, especially if the market breaks above resistance levels.
CRT Application
Using CRT, focus on the range of the inverted cross candle. If tomorrow’s price action breaks below the lower wick, it may confirm bearish momentum. Conversely, a break above the upper wick could indicate bullish strength. Combine this analysis with broader market conditions and technical indicators for confirmation.
Is CRT a Reliable Trading Strategy?
The CRT strategy’s reliability depends on how well it’s tailored to the market. It works effectively under the right conditions, such as in trending or volatile environments. For forex traders, this makes it a versatile tool for both day trading and swing trading.
However, traders should avoid over-reliance on any single method. Candle Range Theory acts best as part of a broader toolkit. Pair it with forex trading indicators like Fibonacci retracements or moving averages for a more balanced approach. This integration boosts your ability to make informed decisions consistently.

Actionable Strategy: How to Trade CRT Today
If you want to implement this immediately, follow this checklist. Do not trade until all criteria are met.
1. Identify the Trap Area
Mark the High and Low of the previous candle (on a higher timeframe like H4 or Daily). These are your liquidity pools.
2. Wait for the Sweep
Switch to a lower timeframe (M15 or M5). Watch price approach these levels.
- Do not place a limit order blindly.
- Wait for price to pierce the level and then show weakness (a wick).
3. Confirm the Reversal (Market Structure Shift)
After the sweep, look for a “Market Structure Shift” (MSS).
- Bullish Example: Price sweeps the low, then breaks above the most recent short-term high.
- Bearish Example: Price sweeps the high, then breaks below the most recent short-term low.

4. Entry and Risk Management
- Entry: Enter on the retest of the candle that caused the shift (often an Order Block).
- Stop Loss: Place your stop loss just beyond the wick of the liquidity sweep. This is a tight, defined risk.
- Take Profit: Target the opposing liquidity. If you bought a sweep of the lows, target the previous highs.
Data-Driven Insights: When to Trade CRT(Session-Based)
Liquidity sweeps are time-sensitive. Proprietary analysis of volatility sessions suggests CRT is not equally effective at all times.
| Session | Time (EST) | Behavior | CRT Suitability |
|---|---|---|---|
| London Open | 2:00 AM – 5:00 AM | High probability of manipulation. The “London Low” or “London High” of the day often forms here. | ✅ Good |
| New York Open | 7:00 AM – 10:00 AM | Most volatile session. Frequent sweeps of London session highs/lows occur here. | ✅ Best |
| Asian Session | 7:00 PM – 2:00 AM | Generally accumulation, low volatility. | ❌ Avoid unless scalping |
Key Takeaway: The highest win-rate setups usually occur when a London High/Low is swept during the New York Open.ate setups usually occur when a London High/Low is swept during the New York Open.
Additionally, focus on understanding candlestick context rather than isolated patterns. For example, long wicks paired with significant candle bodies reflect high rejection levels. This insight helps assess sentiment accurately. Developing the ability to read candlesticks holistically improves your CRT strategy win rate and analysis.
5 Common CRT Mistakes (And How to Fix Them)
| Mistake | Why It Hurts | Fix |
|---|---|---|
| Trading the accumulation phase | Entering before the move, getting stopped out | Wait for manipulation phase to complete |
| Ignoring higher timeframes | Missing the bigger context | Always start with H4 or Daily chart |
| Entering without confirmation | Catching a falling knife | Wait for market structure shift |
| Poor stop placement | Stop too tight or too wide | Place stop beyond the sweep wick |
| Trading wrong sessions | Low volatility = no sweeps | Focus on London/New York opens |
Candle Range Theory (CRT) vs Other Popular Trading Strategies
While Candle Range Theory (CRT) shares similarities with other price action and Smart Money trading methodologies, each approach has its own strengths and learning curve. Understanding the differences can help traders choose the strategy that best matches their trading style and experience.
CRT vs ICT (Inner Circle Trader)
The ICT methodology is one of the most comprehensive Smart Money Concepts (SMC) trading systems. Candle Range Theory borrows similar ideas around liquidity and market manipulation but presents them in a much simpler framework.
| Feature | Candle Range Theory (CRT) | ICT |
|---|---|---|
| Learning Curve | Easy to Moderate | Advanced |
| Focus on Liquidity | ✔ Yes | ✔ Yes |
| Fair Value Gaps (FVG) | Optional Confirmation | Core Concept |
| Order Blocks | Optional | Essential |
| Market Structure | Important | Critical |
| Best for Beginners | ★★★★★ Excellent | ★★★☆☆ Moderate |
Verdict: If you’re new to Smart Money Concepts, CRT offers a simpler path to understanding liquidity sweeps and market manipulation. Traders looking for deeper institutional concepts may eventually expand into ICT.
CRT vs Traditional Price Action
Traditional price action trading focuses on candlestick patterns, support and resistance, and trend analysis. Candle Range Theory goes a step further by identifying where institutional traders may be targeting retail stop losses before the real move begins.
| Feature | CRT | Traditional Price Action |
|---|---|---|
| Main Focus | Liquidity manipulation | Candlestick patterns |
| Stop Hunt Analysis | ✔ Core Principle | Limited |
| Market Psychology | Institutional behaviour | Buyer vs Seller sentiment |
| Entry Precision | High | Moderate |
| Complexity | Moderate | Easy |
Verdict: CRT enhances traditional price action by adding liquidity analysis, helping traders avoid entering just before common stop hunts.
CRT vs Smart Money Concepts (SMC)
Smart Money Concepts is a broad trading methodology that includes liquidity, order blocks, Fair Value Gaps, market structure shifts, premium and discount zones, and institutional order flow. Candle Range Theory focuses primarily on understanding how price moves within candle ranges to identify liquidity grabs and high-probability reversals.
| Feature | CRT | Smart Money Concepts (SMC) |
|---|---|---|
| Learning Difficulty | Moderate | High |
| Liquidity Sweeps | Primary Focus | Primary Focus |
| Order Blocks | Optional | Essential |
| Fair Value Gaps | Optional | Essential |
| Trading Framework | Simplified | Comprehensive |
Verdict: CRT can be viewed as a streamlined Smart Money strategy that emphasizes liquidity without requiring traders to master every SMC concept.
CRT vs Wyckoff Method
The Wyckoff Method has been used for decades to analyze accumulation, distribution, and institutional buying and selling. Although both strategies study market manipulation, their approaches differ significantly.
| Feature | CRT | Wyckoff Method |
|---|---|---|
| Primary Focus | Liquidity sweeps | Accumulation & Distribution |
| Time Horizon | Intraday to Swing | Swing to Long-term |
| Institutional Analysis | ✔ Yes | ✔ Yes |
| Entry Timing | Very Precise | Broader Market Cycles |
| Best For | Active traders | Position and swing traders |
Verdict: Wyckoff focuses on understanding the full market cycle, while CRT is designed to identify precise entry opportunities following liquidity grabs and false breakouts.
Which Trading Strategy Is Best?
There is no universally “best” trading strategy. The right choice depends on your experience, personality, and preferred markets.
- Choose CRT if you want a structured, easy-to-learn strategy centered on liquidity sweeps and institutional price manipulation.
- Choose ICT or SMC if you’re ready to study advanced Smart Money Concepts, including order blocks, Fair Value Gaps, and premium/discount arrays.
- Choose Traditional Price Action if you prefer a straightforward approach based on candlestick patterns and support and resistance.
- Choose Wyckoff if your focus is understanding long-term market cycles, accumulation, and distribution.
For many traders, Candle Range Theory serves as an excellent bridge between traditional price action and more advanced Smart Money Concepts, making it an ideal starting point before progressing to ICT or a full SMC trading framework.
Conclusion
The Candle Range Theory strategy is an effective tool for forex and gold trading. By focusing on candlestick ranges, you can spot trends, reversals, or consolidation zones with precision. While no strategy is foolproof, CRT offers valuable insights when paired with broader technical analysis tools.
FAQS

What is CRT strategy in Forex?
CRT (Candle Range Theory) is a trading strategy that focuses on the range of individual candlesticks. It involves identifying liquidity raids (false breakouts) of a previous candle’s range and trading towards the next liquidity level. The strategy is based on the concepts of accumulation, manipulation, and distribution phases. It is often used on higher timeframes for better accuracy.
How to use the Candle Range Theory?
To use CRT, mark the high and low of a higher timeframe candlestick. Observe price action on a lower timeframe for false breakouts of the range. Confirm the trend reversal using patterns like order blocks or market structure shifts. Enter trades in the direction of the breakout, targeting the next liquidity level.
How to choose a CRT candle?
A good CRT candle has a clear range with defined highs and lows. It should show significant volume and medium to small wicks. Look for candles at key support or resistance levels on higher timeframes. The next candle should confirm the breakout or reversal for a valid setup.


What is CRT and TBS in trading?
CRT (Candle Range Theory) focuses on trading the range of individual candlesticks, leveraging liquidity raids and breakouts. TBS (Turtle Soup) is a related strategy that exploits false breakouts (manipulation phase) to enter trades in the opposite direction. Both strategies aim to capitalize on market inefficiencies.
How to identify CRT in Forex?
Identify candlesticks with clear ranges on higher timeframes and mark their highs and lows. Observe price action on lower timeframes for false breakouts or liquidity raids. Confirm the setup with additional indicators like order blocks or market structure shifts. High-probability setups often occur near key support or resistance levels.
What is the full form of CRT in the stock market?
In trading, CRT stands for Candle Range Theory. It is a methodology that analyzes the range of candlesticks to identify trading opportunities.
Is CRT reliable?
CRT is reliable when used in the right market conditions (trending or volatile) and during active sessions (London/NY open). Like any strategy, it requires practice and proper risk management. Combining CRT with other tools increases its effectiveness.
More Reading on TraderFactor
| Article | What You’ll Learn |
|---|---|
| [How to Read Candlestick Patterns] | Basics of candlestick analysis |
| [Best Timeframes for Forex Trading] | Choose the right chart for your style |
| [Support and Resistance Guide] | Key levels and how to trade them |
| [White Soldiers Candlestick Pattern] | Three white soldiers candlestick pattern. |
| [Forex Spreads vs. Commissions] | Trading costs and how to minimize them |
About the Author
Zahari Rangelov
Head of Business Development, TraderFactor
Zahari specializes in broker analysis, regulatory research, and trading education. He has over a decade of experience helping traders navigate the complex world of online brokers. His expertise spans technical and fundamental analysis, medium-term trading strategies, risk management, and trading psychology. A respected mentor and speaker, Zahari regularly leads webinars and seminars covering market sentiment, speculative instruments, and automated trading systems. His research-backed, practical approach has established him as a trusted authority within the global trading community.
Reviewed By:
Reviewed by Alex Kanyi, Head of Compliance at TraderFactor
“This report is for general information only. Trading involves significant risk. Seek independent advice before acting on any content.”
📚 Continue Building Your Forex Trading Knowledge
Explore these in-depth TraderFactor guides to strengthen your Smart Money Concepts (SMC), price action, and risk management skills.
| Trading Guide | Read |
|---|---|
| How to Use CHoCH and BOS in Trading | Read → |
| How to Identify Liquidity in Forex Trading | Read → |
| Liquidity Sweep in Forex (Smart Money) | Read → |
| Buy Side vs Sell Side Liquidity Explained | Read → |
| What Is Smart Money Concept (SMC)? | Read → |
| How to Spot and Avoid Liquidity Grabs | Read → |
| Forex Breakout Strategy Guide | Read → |
| Understanding Forex Market Imbalance | Read → |
| What Is Negative Balance Protection? | Read → |
Disclaimer:This article is for informational purposes only and does not constitute financial advice. Trading CFDs, forex, stocks, and commodities carries significant risk. Geopolitical events can cause extreme and unexpected market movements. Always verify information from multiple sources.

No comments:
Post a Comment