Trading View Tickers

Saturday 23 December 2023

Bitcoin’s Aims $45K Mark Ahead of ETF

Despite the increasing odds of a spot Bitcoin ETF approval, traders remain somewhat apprehensive, with concerns that the event may already be factored into the pricing.


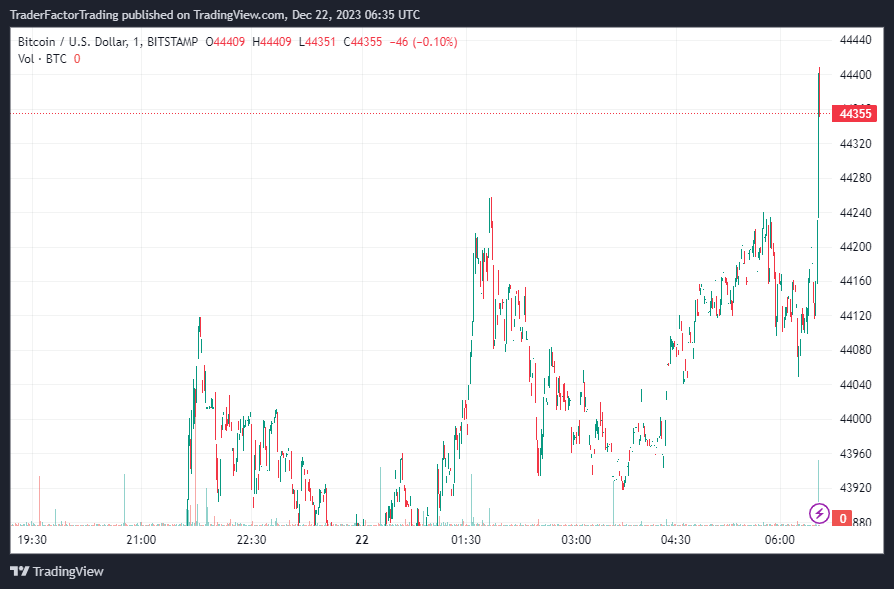
Bitcoin has recently broken above the $40,000 mark for the first time since April 2022. This surge occurred less than two weeks ago, on Dec. 4 and was followed by a rally toward $44,000. However, this resistance level has proven to be a formidable barrier. There are now questions regarding whether a correction down to $41,000 is the most likely scenario.

BTCUSD Daily Chart

BTCUSD Daily Chart

Market Movements Amid ETF Approval Chances

The past 16 days have been marked by several rejections at $44,000 and subsequent retests of the $41,000 support. Interestingly, these fluctuations have occurred in conjunction with an increase in the likelihood of a spot Bitcoin ETF approval by January, as reported by Bloomberg ETF analysts. This comes after multiple issuers amended their filings to comply with the cash redemption model demanded by securities regulators.

Firms such as BlackRock have updated their S-1 registration statements to exclude non-monetary payments, known as ‘in-kind’. Essentially, the creation and redemption of ETF shares will happen in cash, rather than allowing participants to pay or be compensated in Bitcoin, although the fund itself will retain the ability to hold the actual cryptocurrency.

Traders’ Speculations Regarding ETF Impact on Bitcoin Price

Some traders put forth the idea that the spot ETF listing adheres to the ‘buy the rumor, sell the news’ pattern. This suggests that savvy investors anticipate the launch, causing most gains to occur before the actual regulatory approval.

There’s also speculation about the balanced demand between BTC put and call options due to regulatory uncertainty. The Bitcoin options market tells a slightly different story, as call (buy) and put (sell) options have been trading at similar price levels for the past week. Despite Bitcoin’s price rallying 15.4% in December, there’s not been an increased demand for downside protection.

Regulatory Risks and Investor Confidence

Despite the excitement surrounding the potential approval of a spot Bitcoin ETF, regulatory risk remains high, especially for cryptocurrency exchanges. On Dec. 15, the U.S. Securities and Exchange Commission (SEC) denied Coinbase’s petition for rulemaking on cryptocurrency. This decision strengthened the $44,000 resistance level and limited investors’ appetite.

However, looking at the bigger picture, Bitcoin’s 164% year-to-date gains significantly outshine the stock market’s 23.2% increase, as measured by the S&P 500 index. This discrepancy has prompted some profit-taking movements in the cryptocurrency. Nonetheless, Bitcoin whales seem unfazed by the latest rejection, as indicated by BTC derivatives metrics, leaving room for further gains before the actual spot ETF approval.

Spectrum of Bitcoin Price Predictions Amid ETF Decision

In the wake of the upcoming Bitcoin ETF decision, the crypto world is abuzz with a variety of price predictions. Some analysts envision a moderate climb, with the price of Bitcoin expected to fluctuate between $42,000 and $100,000 post-ETF approval. Yet, there are those in the financial sector who voice a far more bullish view, anticipating a potential surge to a high of $160,000 or even an astounding $1,000,000. Such optimism largely stems from the potential influx of institutional investment and supply dynamics that could be ignited by the approval of an ETF.

Blockstream CEO’s Bullish Forecast

Adam Back, the CEO of Blockstream, is among the optimists predicting a significant rise in Bitcoin’s value, projecting it could hit the $100,000 mark. Back suggests this surge could occur even prior to the introduction of an ETF and the forthcoming Bitcoin halving event. He emphasizes the profound impact an ETF could have on Bitcoin’s value, highlighting its potential to drastically reshape the market dynamics of the cryptocurrency.

CryptoQuant’s Prediction for Bitcoin

Echoing this optimism, on-chain analysis firm CryptoQuant has divulged to BeInCrypto their prediction that Bitcoin will surpass the $160,000 mark. Their forecast hinges on several pivotal factors, including the expected surge in Bitcoin demand following the approval of multiple ETFs, the impending Bitcoin halving event, and a potential rally in the broader stock markets prompted by interest rate cuts.


Disclaimer:

All information has been prepared by TraderFactor or partners. The information does not contain a record of TraderFactor or partner’s prices or an offer of or solicitation for a transaction in any financial instrument. No representation or warranty is given as to the accuracy or completeness of this information. Any material provided does not have regard to the specific investment objective and financial situation of any person who may read it. Past performance is not a reliable indicator of future performance. 

FOLLOW US

Author

  • Zahari Rangelov

    Zahari Rangelov is an experienced professional Forex trader and trading mentor with knowledge in technical and fundamental analysis, medium-term trading strategies, risk management and diversification. He has been involved in the foreign exchange markets since 2005, when he opened his first live account in 2007. Currently, Zahari is the Head of Sales & Business Development at TraderFactor's London branch. He provides lectures during webinars and seminars for traders on topics such as; Psychology of market participants’ moods, Investments & speculation with different financial instruments and Automated Expert Advisors & signal providers. Zahari’s success lies in his application of research-backed techniques and practices that have helped him become a successful forex trader, a mentor to many traders, and a respected authority figure within the trading community.

Friday 22 December 2023

Gold Price Regains Traction, EUR/USD Stabilizes Ahead of PCE Price Index Data

Gold price struggles to gather a directional move, fluctuating in a tight channel above $2,030 on Thursday. 


The benchmark 10-year US Treasury bond yield is attempting to recover gains near 3.9% ahead of US data, but this doesn’t seem to provide traction to XAU/USD.

XAUUSD Daily Chart

XAUUSD Daily Chart

Gold Price Regains Traction

On Thursday, the Gold price (XAU/USD) regains positive traction and reverses a significant portion of the previous day’s downfall. This is largely due to the underlying bearish sentiment surrounding the US Dollar (USD). Growing acceptance that the Federal Reserve (Fed) will pivot away from its hawkish stance and start cutting interest rates as early as March 2024 has dragged the US Treasury bond yields to a multi-month low. This situation benefits the US Dollar-denominated commodity.

Global Rate-Cutting Cycle

The prospect of a global rate-cutting cycle suggests that the path of least resistance for the non-yielding Gold price remains to the upside. The median forecast in Federal Open Market Committee (FOMC) members’ Summary of Economic Projections has the federal-funds rate ending 2024 at 4.6%, signalling three 25 basis points (bps) rate cuts.

Impact of Inflation Data and Interest Rate Cuts

Softer-than-expected inflation data from the Eurozone, along with the softening in rhetoric from several European Central Bank (ECB) members, suggest that the risk has now shifted towards earlier rate cuts. However, Fed and ECB officials have been pushing back against market bets for rapid interest rate cuts next year, holding back bulls from placing aggressive bets around the Gold price. Traders also prefer to wait on the sidelines ahead of key US data releases.

Key Data Risk and USD Demand

In the run-up to the key data risk, traders on Thursday will take cues from the US economic docket – featuring the final Q3 GDP print, the usual Initial Weekly Jobless Claims and the Philly Fed Manufacturing Index. This, along with the US bond yields, will drive the USD demand and provide some impetus to the Gold price later during the early North American session.

EUR/USD Stabilization

EUR/USD stabilized after recovering toward 1.0950 early Thursday, bouncing back from the intraday low at 1.0929 incurred in the previous session. The US economic docket will feature weekly Initial Jobless Claims and final revisions to Q3 GDP.

Wall Street’s Impact and US Economy Forecast

In the late American session, Wall Street’s main indexes turned south, reflecting a negative shift in risk mood. Early Thursday, US stock index futures trade in positive territory, pointing to an improving market mood. The US Bureau of Economic Analysis will release the final revision to third-quarter (GDP). The US economy is forecast to expand at an annual rate of 5.2%. A downward revision could weigh on the USD with the immediate reaction.

GBP/USD: A Focus on US GDP Data

The GBP/USD pair maintains its position below 1.2650, focusing on US GDP data. After a sharp decline prompted by soft UK inflation data on Wednesday, the pair seems to have stabilized below 1.2650 on Thursday. The revisions to the US’ third-quarter GDP will be closely watched later in the day.

Impact of Soft UK Inflation Data on GBP/USD

GBP/USD stabilized near 1.2650 early Thursday after losing nearly 100 pips on Wednesday. Despite a near-term technical outlook suggesting a loss of bearish momentum, the pair may struggle to rise steadily following the soft inflation readings from the UK.

Market Position Shifts Towards Earlier BoE Policy Pivot

Market positioning has shifted towards an earlier Bank of England (BoE) policy pivot following the UK Consumer Price Index (CPI) readings for November, which came in below analysts’ forecasts on Wednesday. Goldman Sachs now predicts that the BoE will opt for a 25 basis points rate cut in May, compared to their previous forecast of June.

USD Struggles Amid Improving Risk Mood

The US Dollar (USD) is struggling to find demand early Thursday, helping GBP/USD maintain its position. US stock index futures were last seen rising between 0.4% and 0.6%, reflecting an improving risk mood. If Wall Street’s main indexes open higher and gather bullish momentum in the second half of the day, the USD could continue to weaken against its peers.

Potential Impact of US Economic Docket

The US economic docket will feature the final revision to the third-quarter Gross Domestic Product growth alongside the weekly Initial Jobless Claims. If the number of first-time applications for unemployment benefits rises at a stronger pace than anticipated, the USD could come under pressure. Conversely, a reading at or below 200K could provide a boost to the USD, potentially triggering another downward shift in GBP/USD.

GBPUSD Daily Chart

GBPUSD Daily Chart

Disclaimer:

All information has been prepared by TraderFactor or partners. The information does not contain a record of TraderFactor or partner’s prices or an offer of or solicitation for a transaction in any financial instrument. No representation or warranty is given as to the accuracy or completeness of this information. Any material provided does not have regard to the specific investment objective and financial situation of any person who may read it. Past performance is not a reliable indicator of future performance. 

FOLLOW US

Author

  • Zahari Rangelov

    Zahari Rangelov is an experienced professional Forex trader and trading mentor with knowledge in technical and fundamental analysis, medium-term trading strategies, risk management and diversification. He has been involved in the foreign exchange markets since 2005, when he opened his first live account in 2007. Currently, Zahari is the Head of Sales & Business Development at TraderFactor's London branch. He provides lectures during webinars and seminars for traders on topics such as; Psychology of market participants’ moods, Investments & speculation with different financial instruments and Automated Expert Advisors & signal providers. Zahari’s success lies in his application of research-backed techniques and practices that have helped him become a successful forex trader, a mentor to many traders, and a respected authority figure within the trading community.

UK November CPI Rises Slower, GBP/USD Drops

The United Kingdom’s Consumer Price Index (CPI) saw an annual increase of 3.9% in November, a decline from October’s 4.6% rise. This figure was lower than the market’s anticipated acceleration of 4.4%. Meanwhile, the Consumer Prices Index including owner occupiers’ housing costs (CPIH) rose by 4.2% year over year to November 2023, down from 4.7% in October 2023.


On a monthly basis, both CPI and CPIH fell, with the former dropping by 0.2% and the latter decreasing by 0.1%. These figures contrast with November 2022’s rise of 0.4% for both indices.

Key Contributors to Inflation Trends

The most significant downward contributions to the monthly change in both CPIH and CPI annual rates were from transport, recreation and culture, and food and non-alcoholic beverages.

Core Inflation Figures

Excluding volatile items such as energy, food, alcohol, and tobacco, core CPIH rose by 5.2% in the 12 months to November 2023, down from 5.6% in October. Similarly, core CPI increased by 5.1% year over year in November, a decrease from October’s 5.7%. Both figures were lower than the expected 5.6%.

GBP/USD Reaction to Inflation Data

The release of the UK’s inflation data triggered a selling wave for the GBP/USD, causing it to drop below 1.2700. The pair has fallen 0.60% on the day, trading above 1.2650.

Long-Term Inflation Trends

The CPIH rose by 4.2% in the 12 months to November 2023, down from October’s 4.7% and a peak of 9.6% in October 2022. This suggests that the October 2022 rate was the highest in over 40 years. In contrast, November 2023’s annual rate was the lowest since October 2021.

IndexNov 2023 YoYOct 2023 YoYNov 2023 MoMNov 2022 MoM
CPI3.9%4.6%-0.2%0.4%
CPIH4.2%4.7%-0.1%0.4%
Core CPI5.1%5.7%N/AN/A
Core CPIH5.2%5.6%N/AN/A

Disclaimer:

All information has been prepared by TraderFactor or partners. The information does not contain a record of TraderFactor or partner’s prices or an offer of or solicitation for a transaction in any financial instrument. No representation or warranty is given as to the accuracy or completeness of this information. Any material provided does not have regard to the specific investment objective and financial situation of any person who may read it. Past performance is not a reliable indicator of future performance. 

FOLLOW US

Author

  • Zahari Rangelov

    Zahari Rangelov is an experienced professional Forex trader and trading mentor with knowledge in technical and fundamental analysis, medium-term trading strategies, risk management and diversification. He has been involved in the foreign exchange markets since 2005, when he opened his first live account in 2007. Currently, Zahari is the Head of Sales & Business Development at TraderFactor's London branch. He provides lectures during webinars and seminars for traders on topics such as; Psychology of market participants’ moods, Investments & speculation with different financial instruments and Automated Expert Advisors & signal providers. Zahari’s success lies in his application of research-backed techniques and practices that have helped him become a successful forex trader, a mentor to many traders, and a respected authority figure within the trading community.